 8
8peptides
spectra
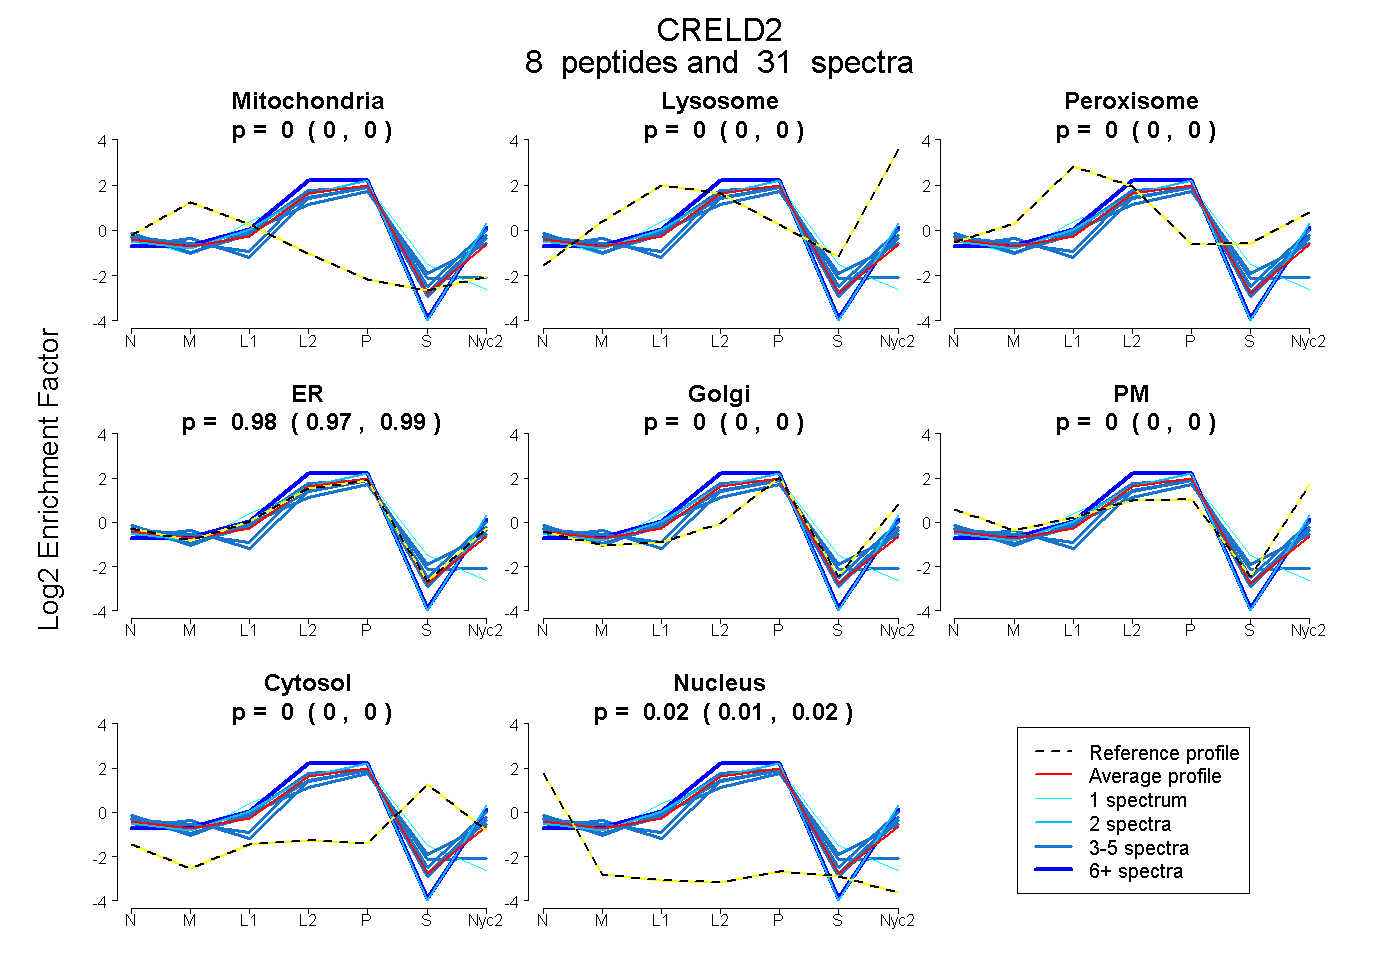
0.000 | 0.000
0.000 | 0.000
0.000 | 0.000
0.975 | 0.989
0.000 | 0.000
0.000 | 0.000
0.000 | 0.000
0.010 | 0.024
3peptides
spectra
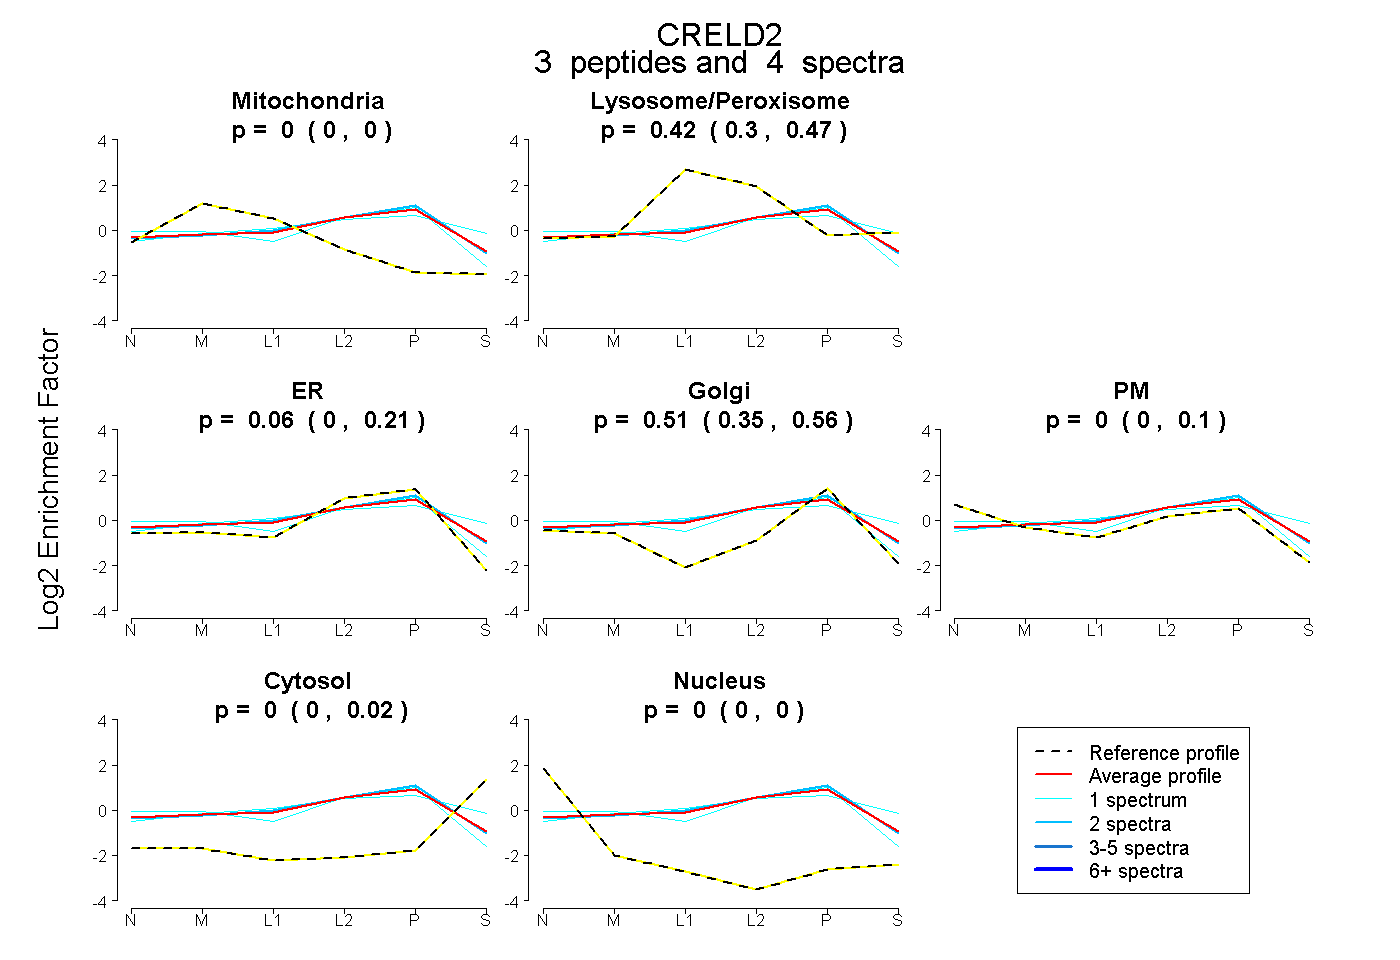
0.000 | 0.004
0.303 | 0.473
0.000 | 0.213
0.349 | 0.555
0.000 | 0.098
0.000 | 0.020
0.000 | 0.000
9peptides
spectra
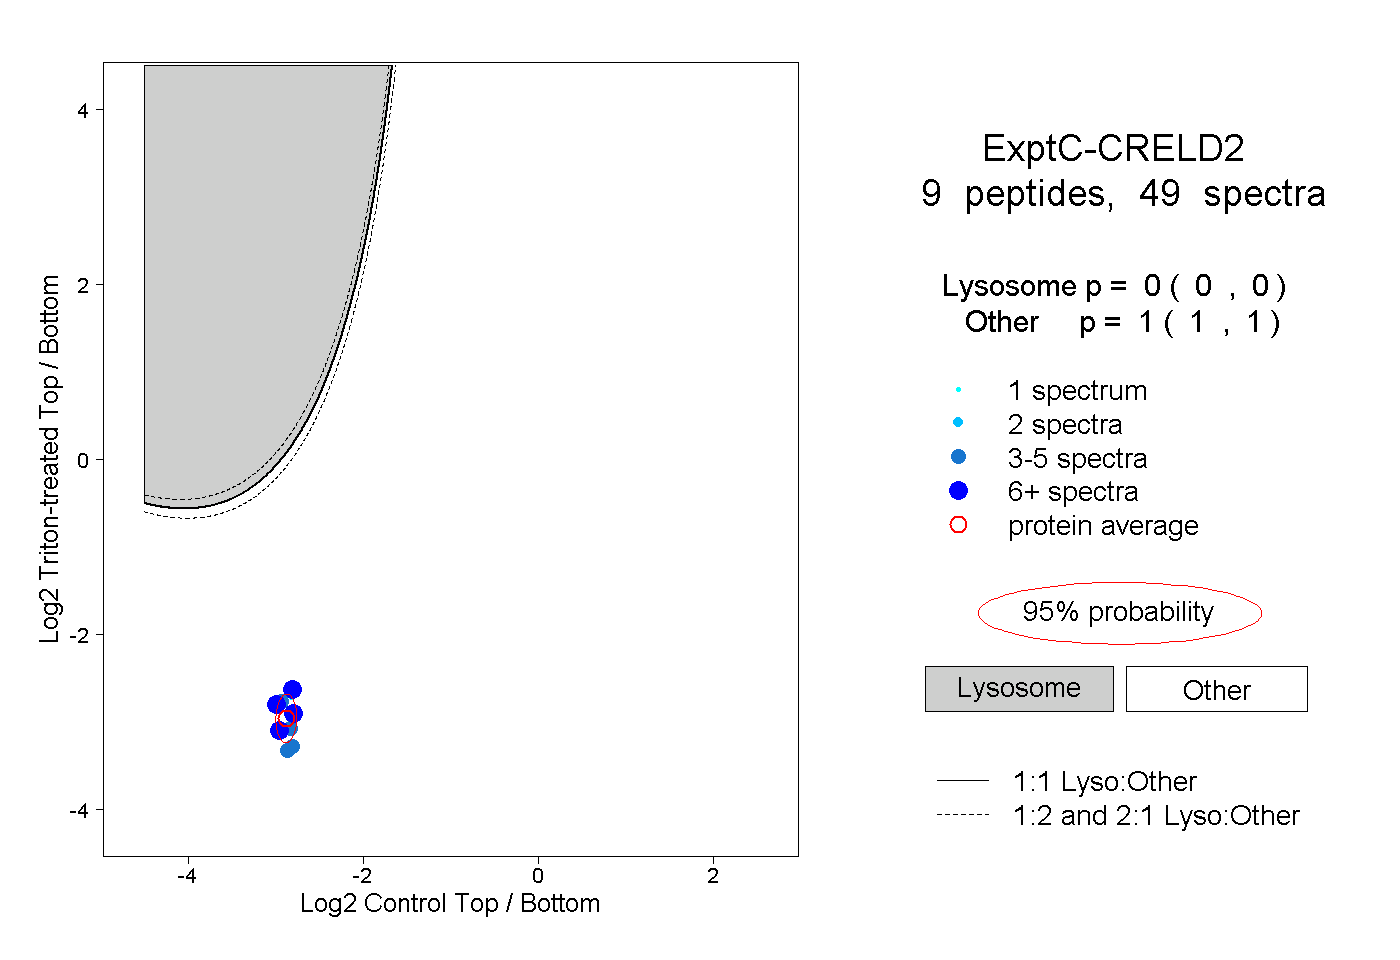
0.000 | 0.000
1.000 | 1.000
1peptide
spectra
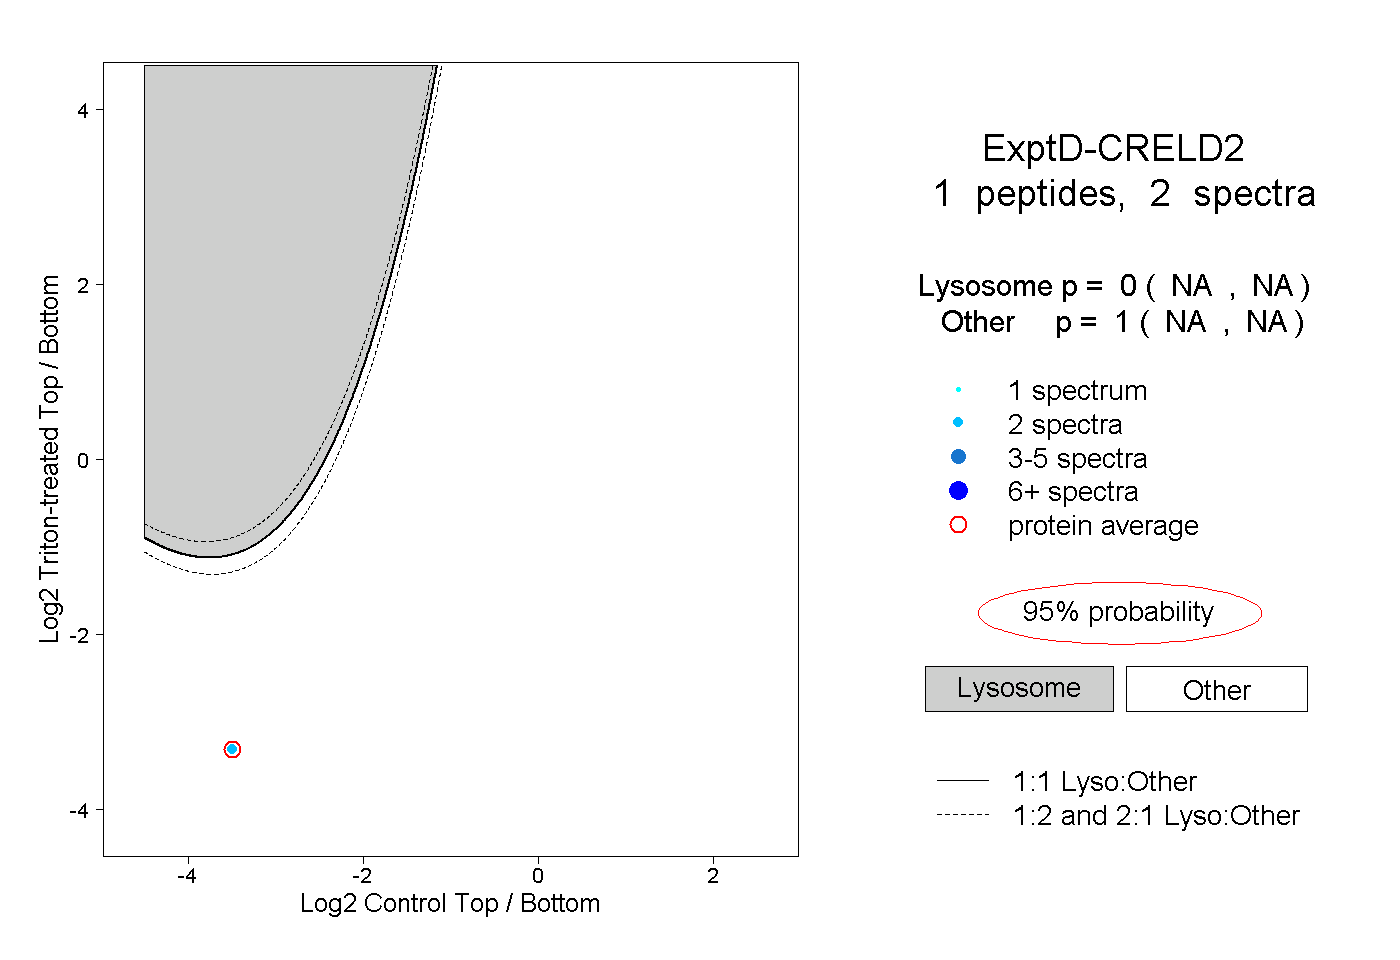
NA | NA
NA | NA