CRELD2
[ENSRNOP00000006357]
Main page
| | | Plot |
Mito |
Lyso |
|
Perox |
ER |
Golgi |
PM |
Cytosol |
Nucleus |
|
| Expt A |
 8
8
peptides |
31
spectra |
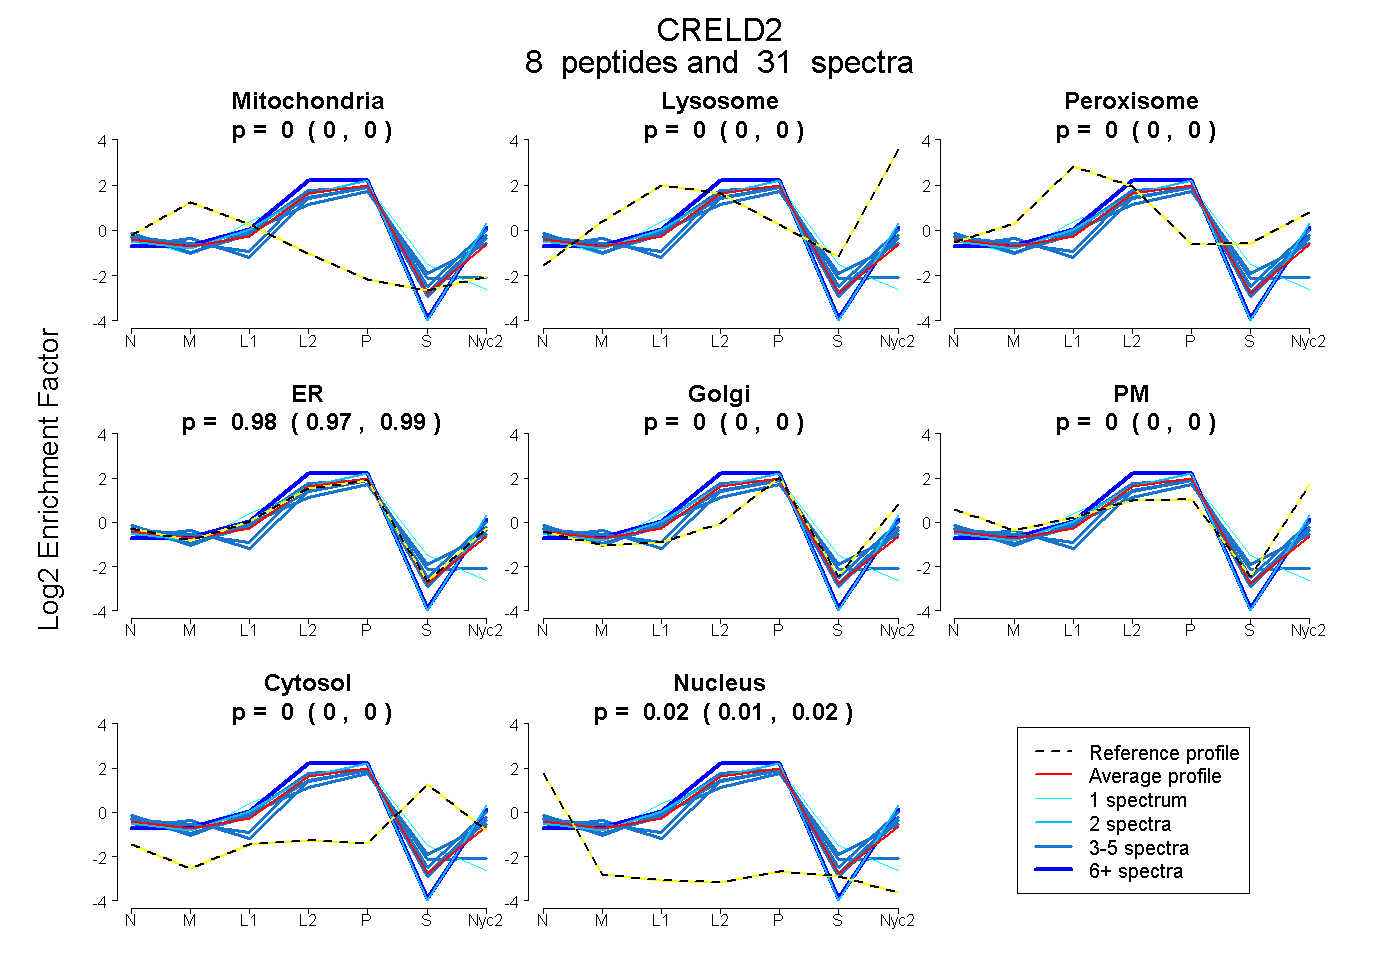 |
0.000
0.000 | 0.000 |
0.000
0.000 | 0.000 |
|
0.000
0.000 | 0.000 |
0.982
0.975 | 0.989 |
0.000
0.000 | 0.000 |
0.000
0.000 | 0.000 |
0.000
0.000 | 0.000 |
0.018
0.010 | 0.024 |
|
| | | Plot |
Mito |
|
Lyso or Perox |
|
ER |
Golgi |
PM |
Cytosol |
Nucleus |
|
| Expt B |
3
peptides |
4
spectra |
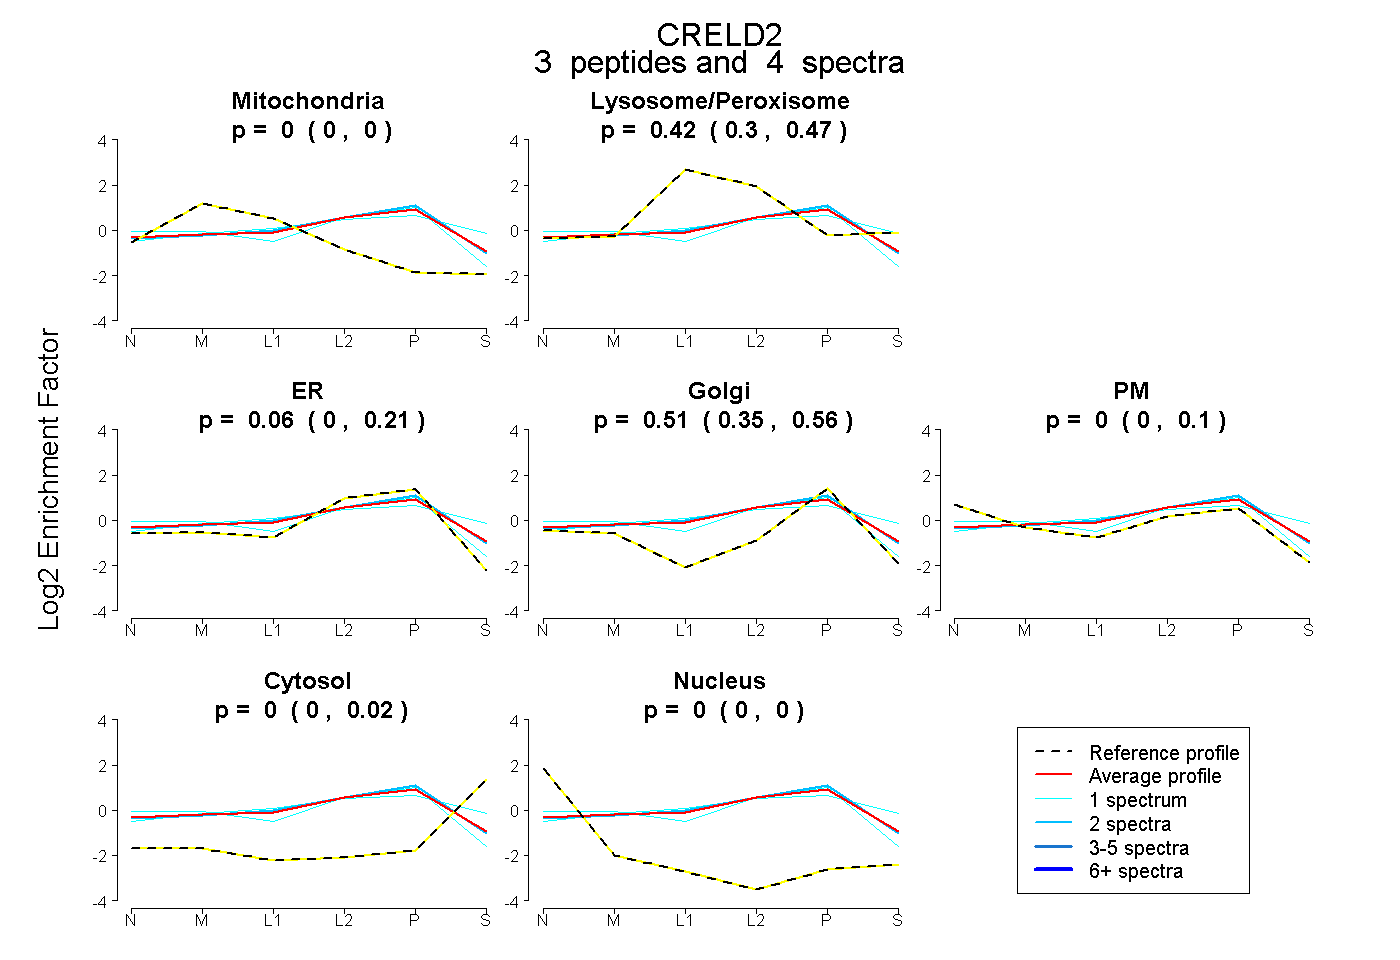 |
0.000
0.000 | 0.004 |
|
0.421
0.303 | 0.473 |
|
0.064
0.000 | 0.213 |
0.515
0.349 | 0.555 |
0.000
0.000 | 0.098 |
0.000
0.000 | 0.020 |
0.000
0.000 | 0.000 |
|
| 1 spectrum, TCSGPSNK |
0.000 |
|
0.159 |
|
0.319 |
0.174 |
0.348 |
0.000 |
0.000 |
|
| 1 spectrum, ECIAGYTK |
0.000 |
|
0.490 |
|
0.000 |
0.403 |
0.000 |
0.107 |
0.000 |
|
| 2 spectra, YEFSEIR |
0.000 |
|
0.396 |
|
0.156 |
0.448 |
0.000 |
0.000 |
0.000 |
|
| | | Plot |
|
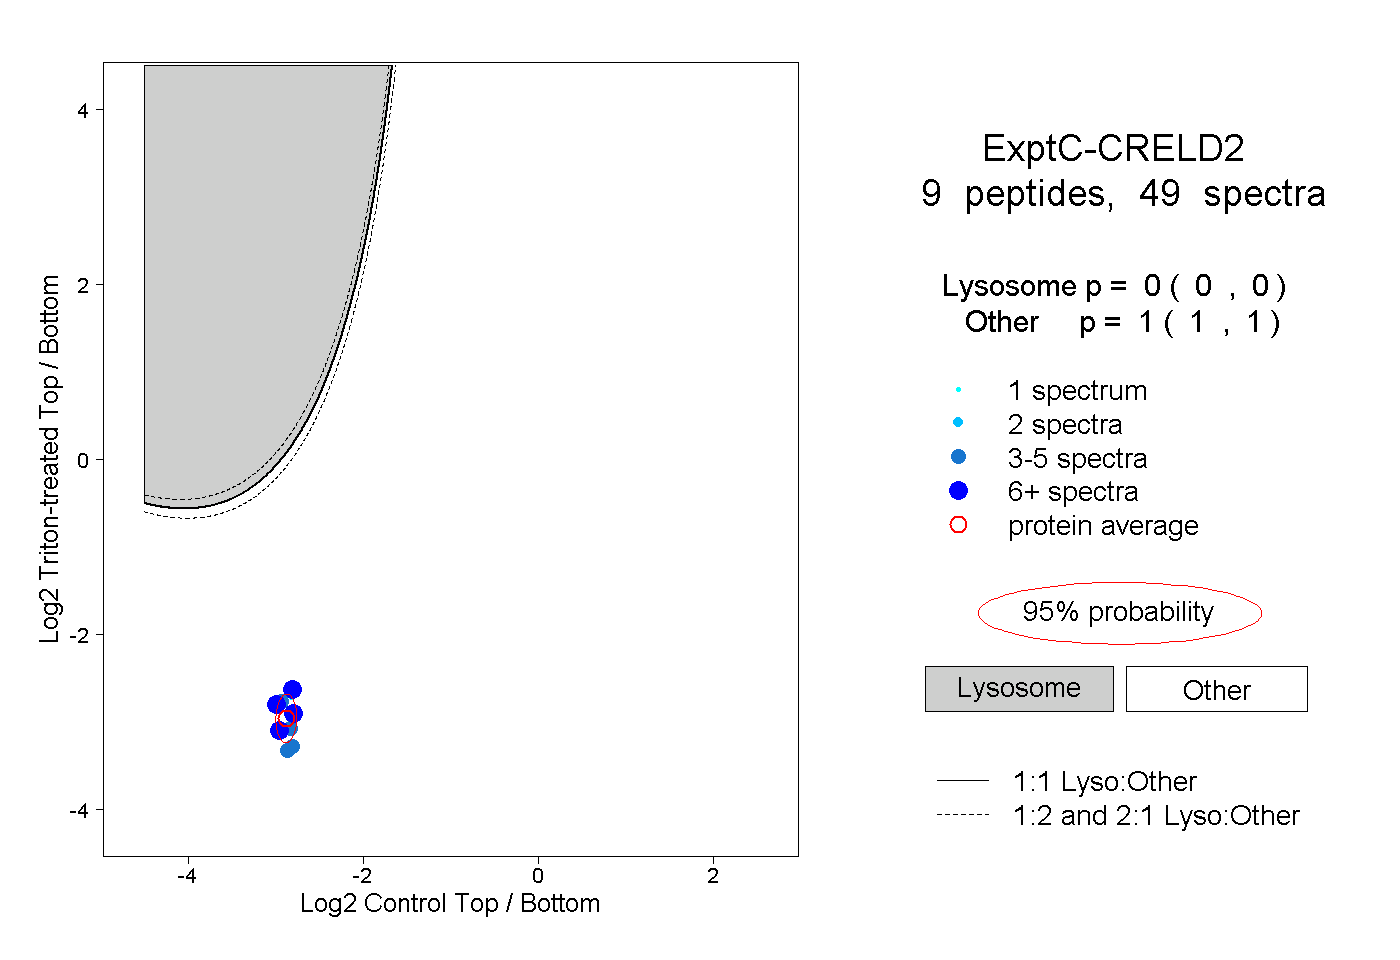
Lyso |
|
|
|
|
|
|
|
Other |
| Expt C |
9
peptides |
49
spectra |
 |
|
0.000
0.000 | 0.000 |
|
|
|
|
|
|
|
1.000
1.000 | 1.000 |
| | | Plot |
|
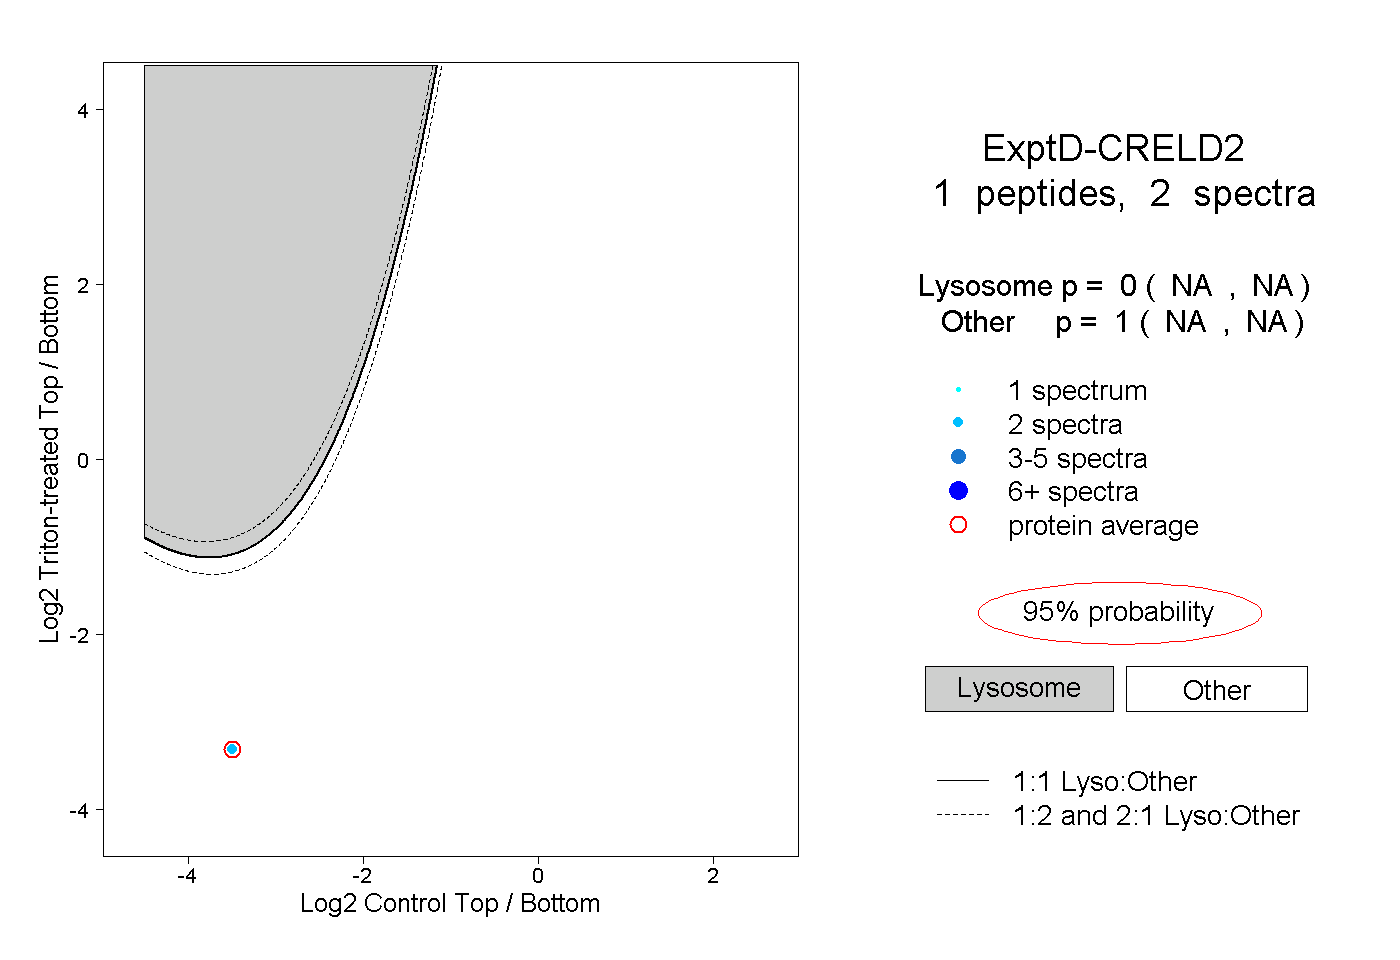
Lyso |
|
|
|
|
|
|
|
Other |
| Expt D |
1
peptide |
2
spectra |
 |
|
0.000
NA | NA |
|
|
|
|
|
|
|
1.000
NA | NA |