 22
22peptides
spectra
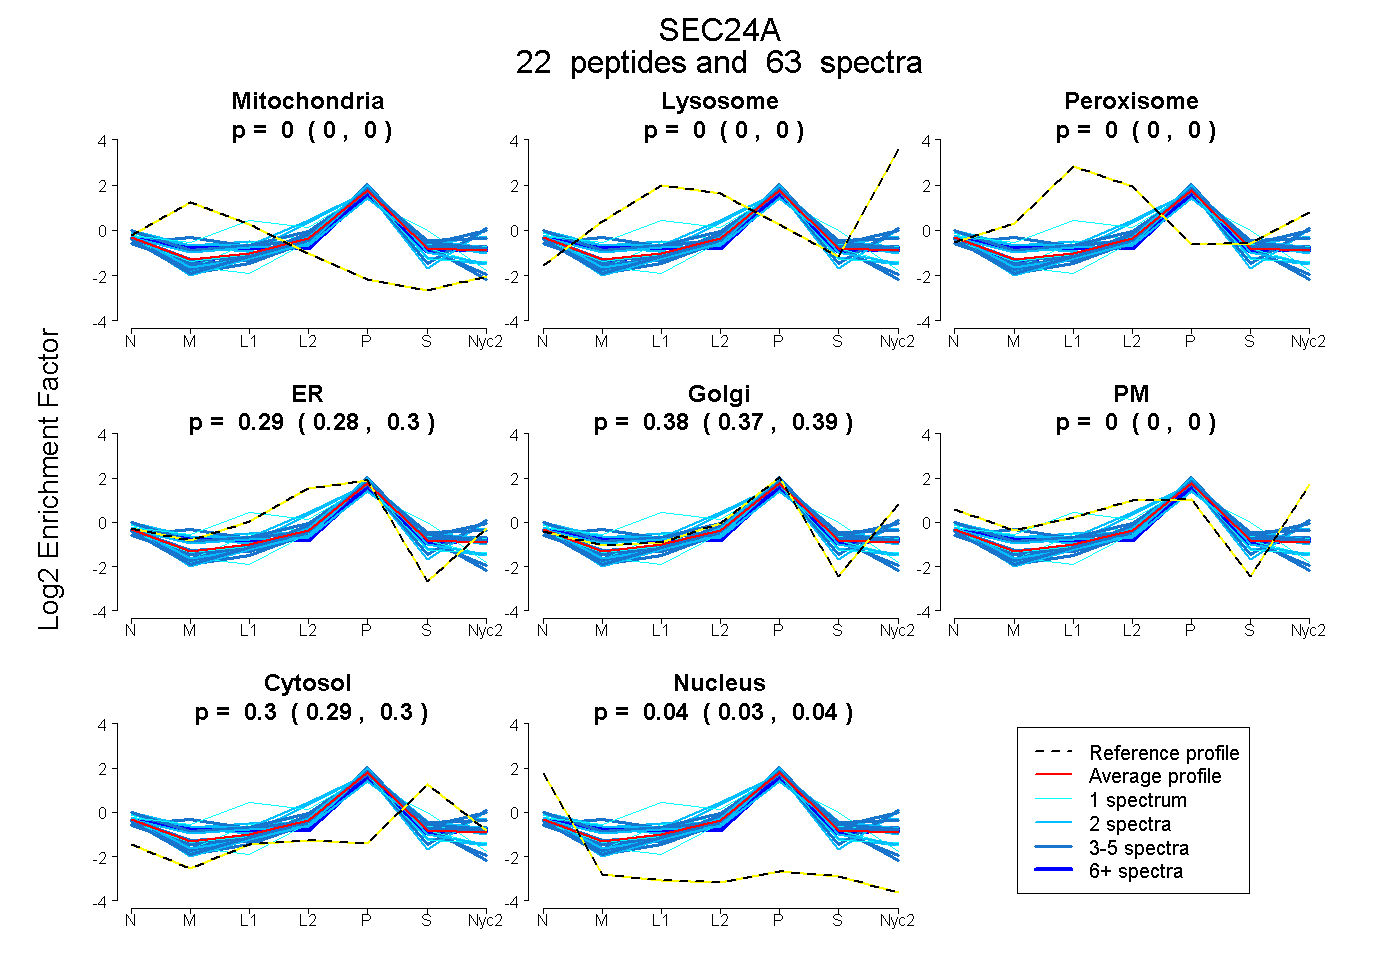
0.000 | 0.000
0.000 | 0.000
0.000 | 0.000
0.276 | 0.296
0.366 | 0.390
0.000 | 0.000
0.293 | 0.300
0.034 | 0.040
10peptides
spectra
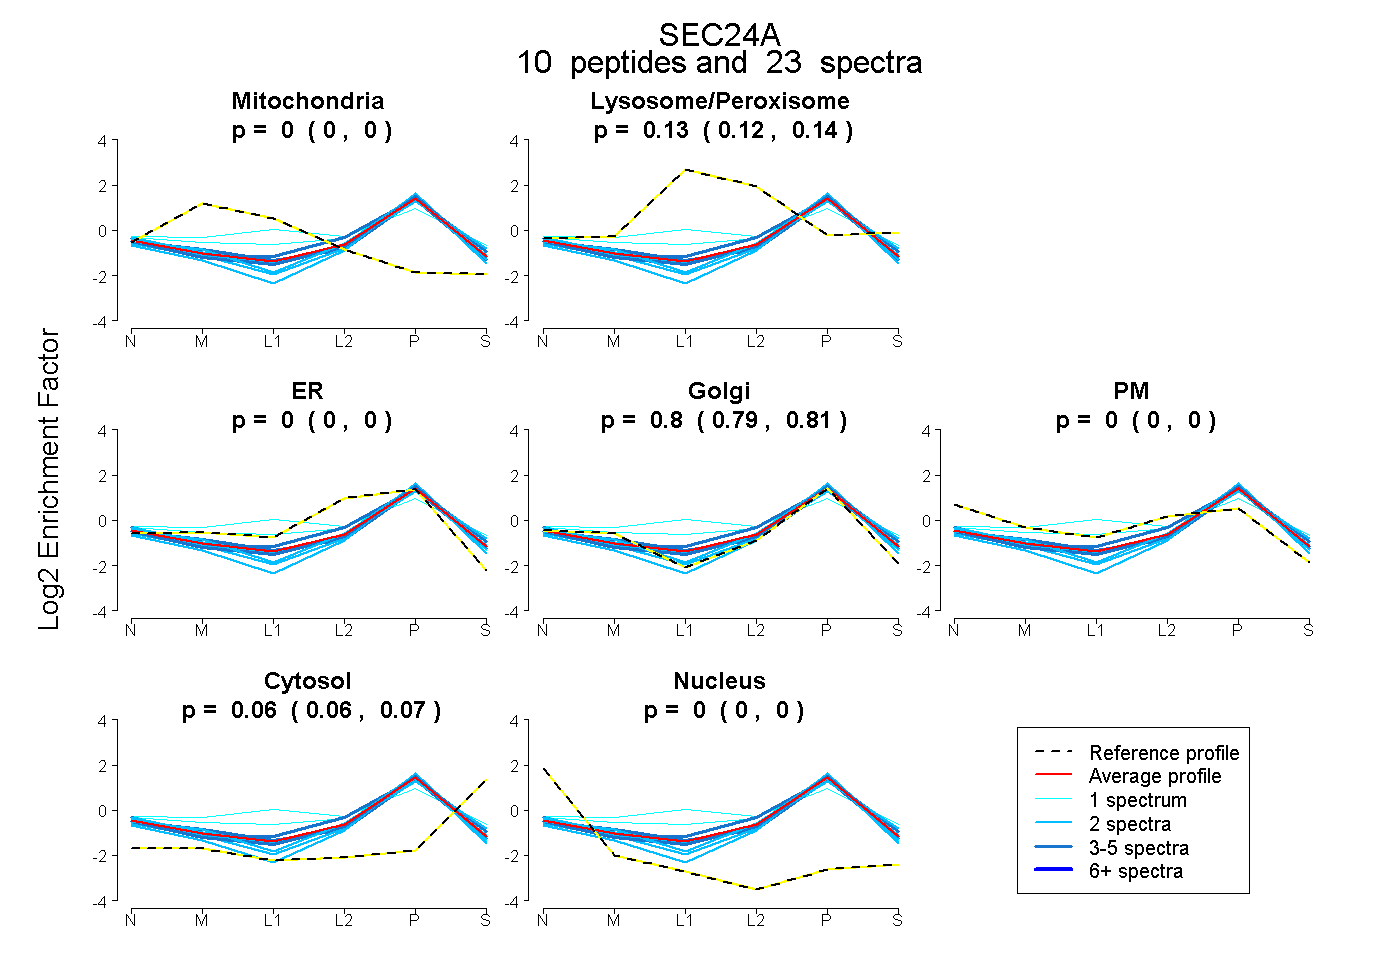
0.000 | 0.000
0.122 | 0.143
0.000 | 0.000
0.795 | 0.811
0.000 | 0.000
0.057 | 0.069
0.000 | 0.000
19peptides
spectra
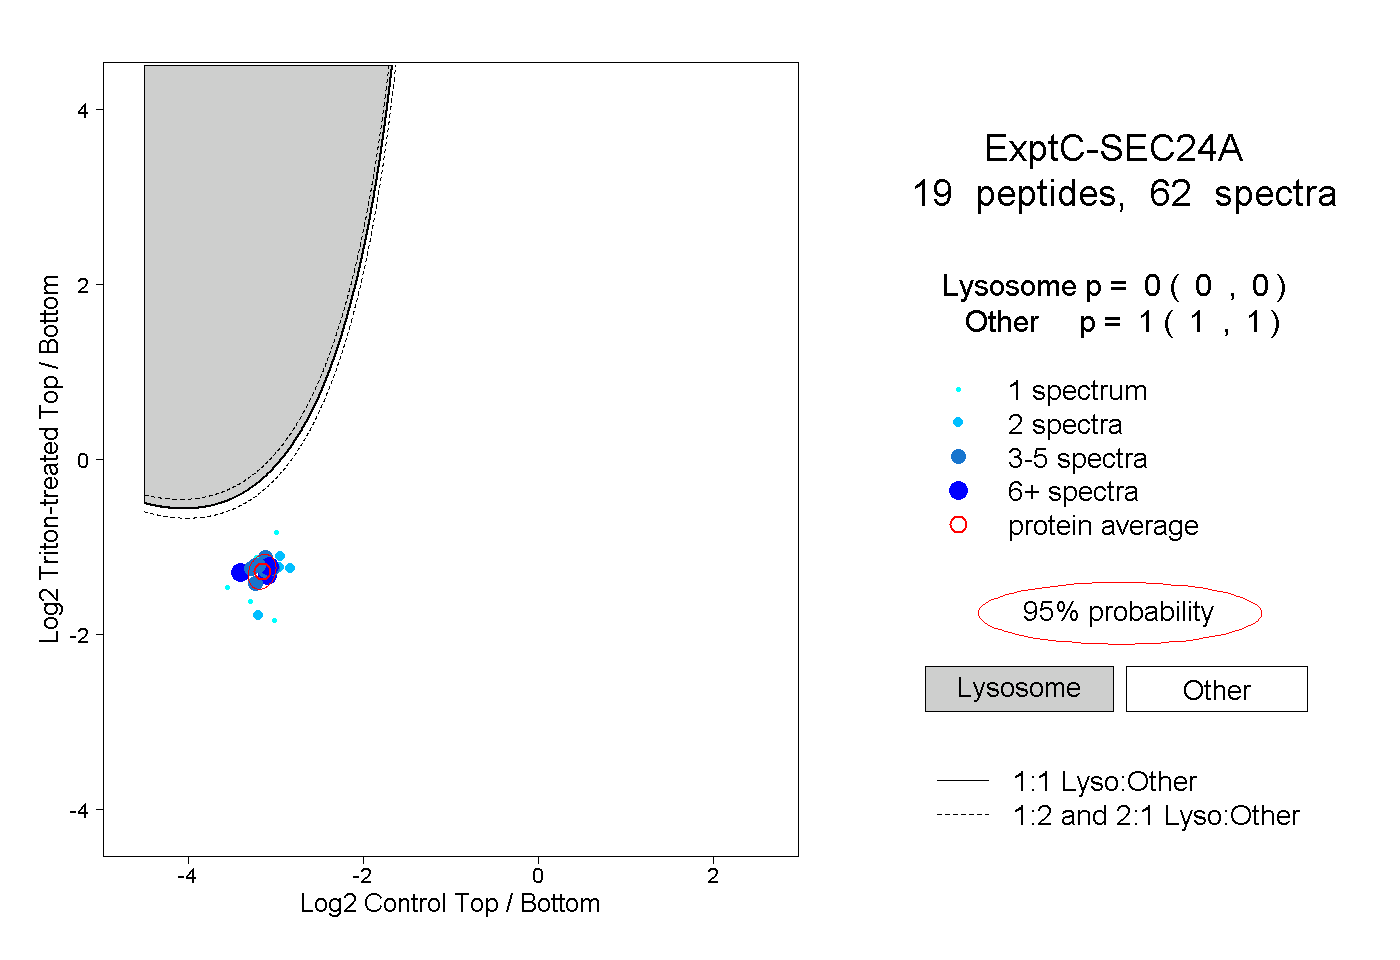
0.000 | 0.000
1.000 | 1.000
7peptides
spectra
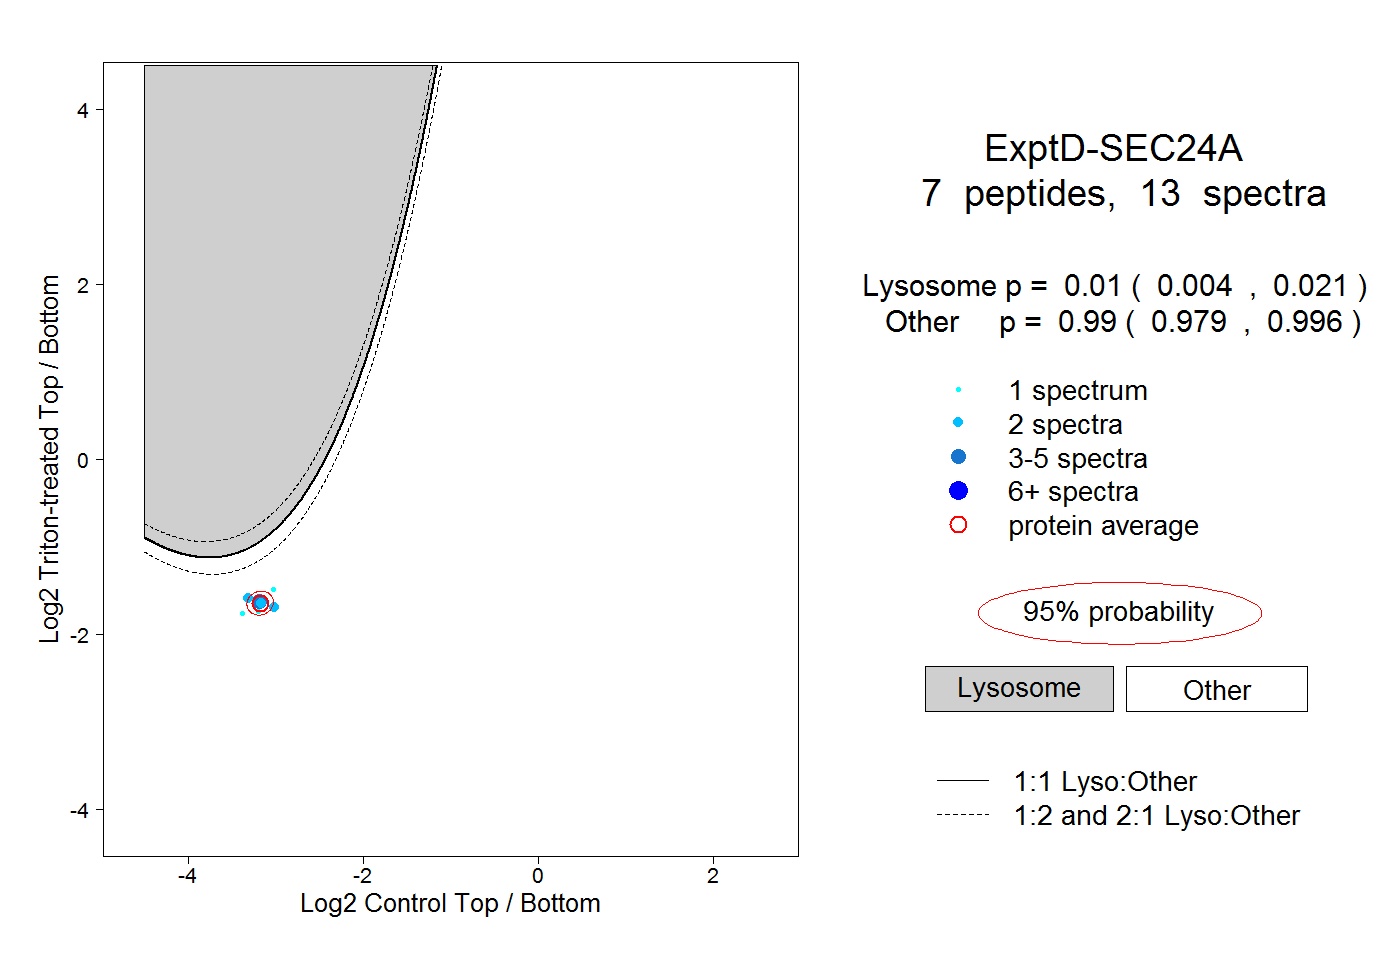
0.004 | 0.021
0.979 | 0.996