 12
12peptides
spectra
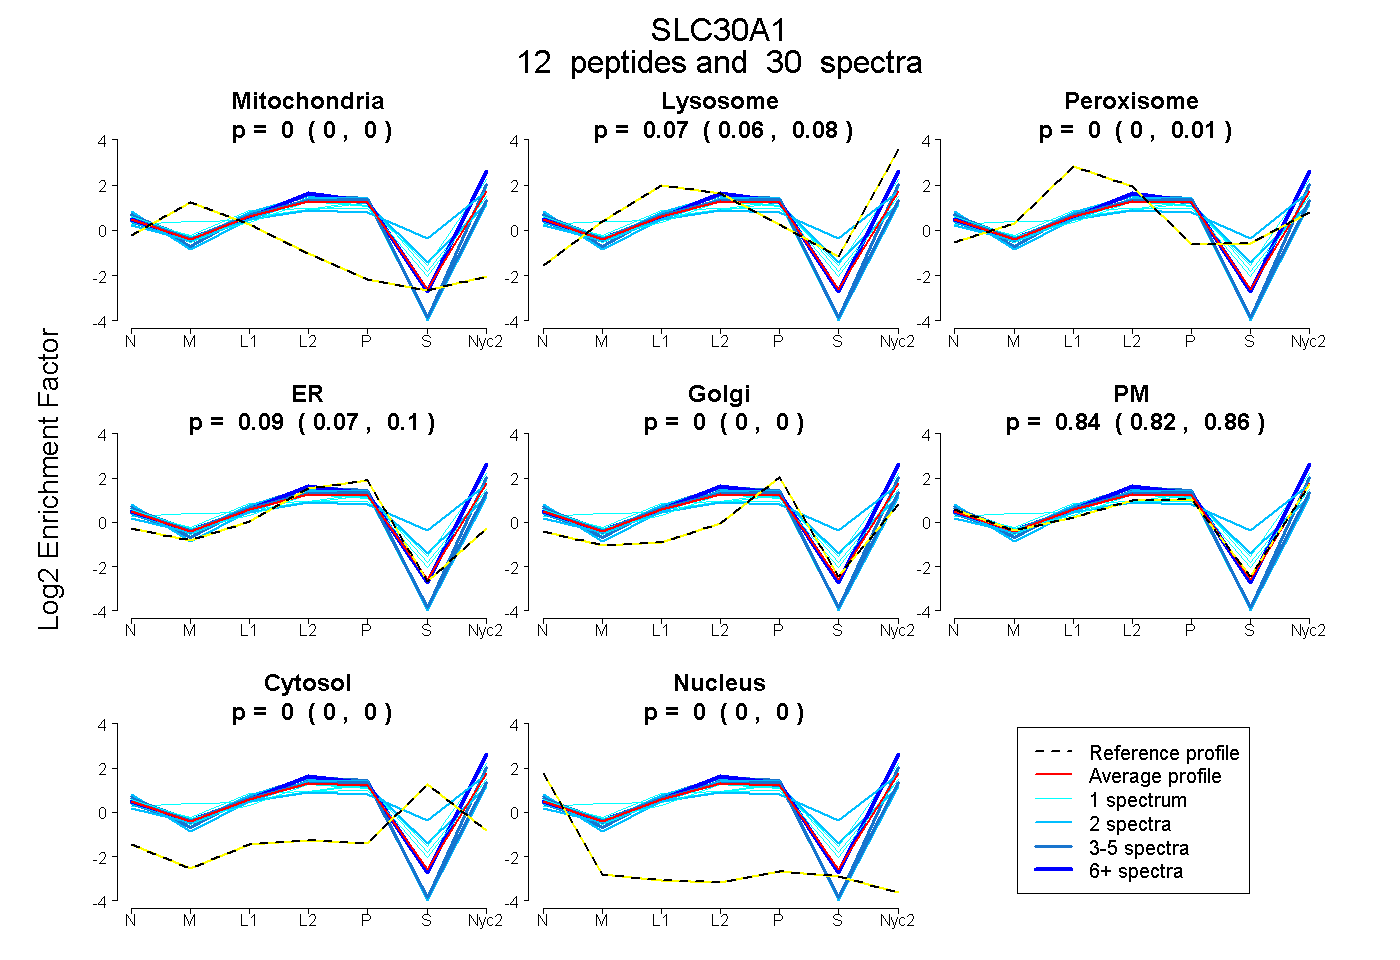
0.000 | 0.000
0.057 | 0.079
0.000 | 0.013
0.068 | 0.099
0.000 | 0.000
0.824 | 0.862
0.000 | 0.000
0.000 | 0.000
5peptides
spectra
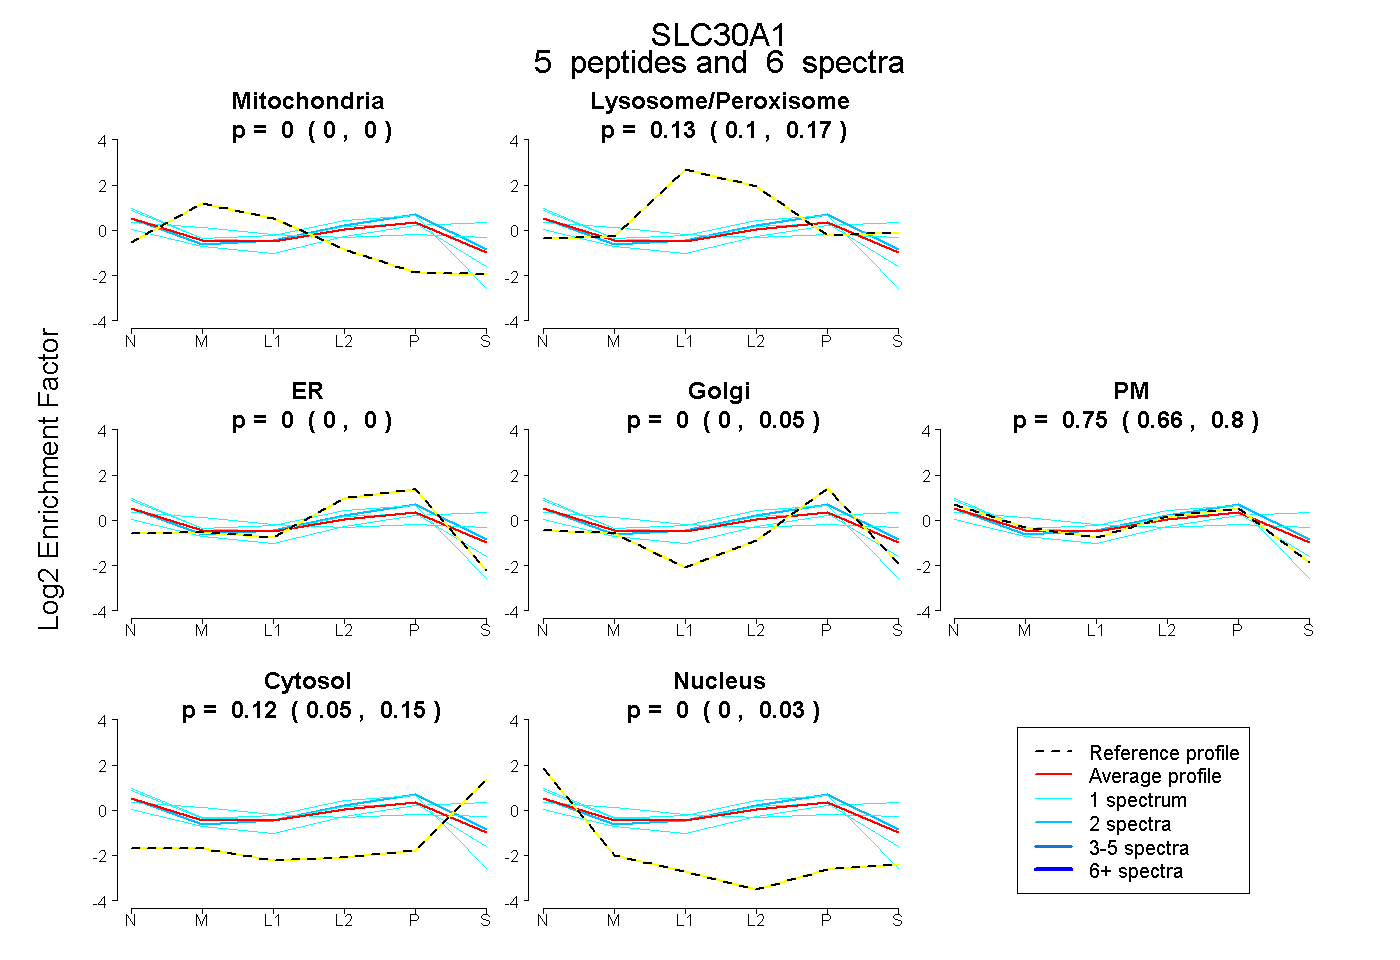
0.000 | 0.000
0.099 | 0.172
0.000 | 0.000
0.000 | 0.045
0.662 | 0.799
0.047 | 0.153
0.000 | 0.028
10peptides
spectra
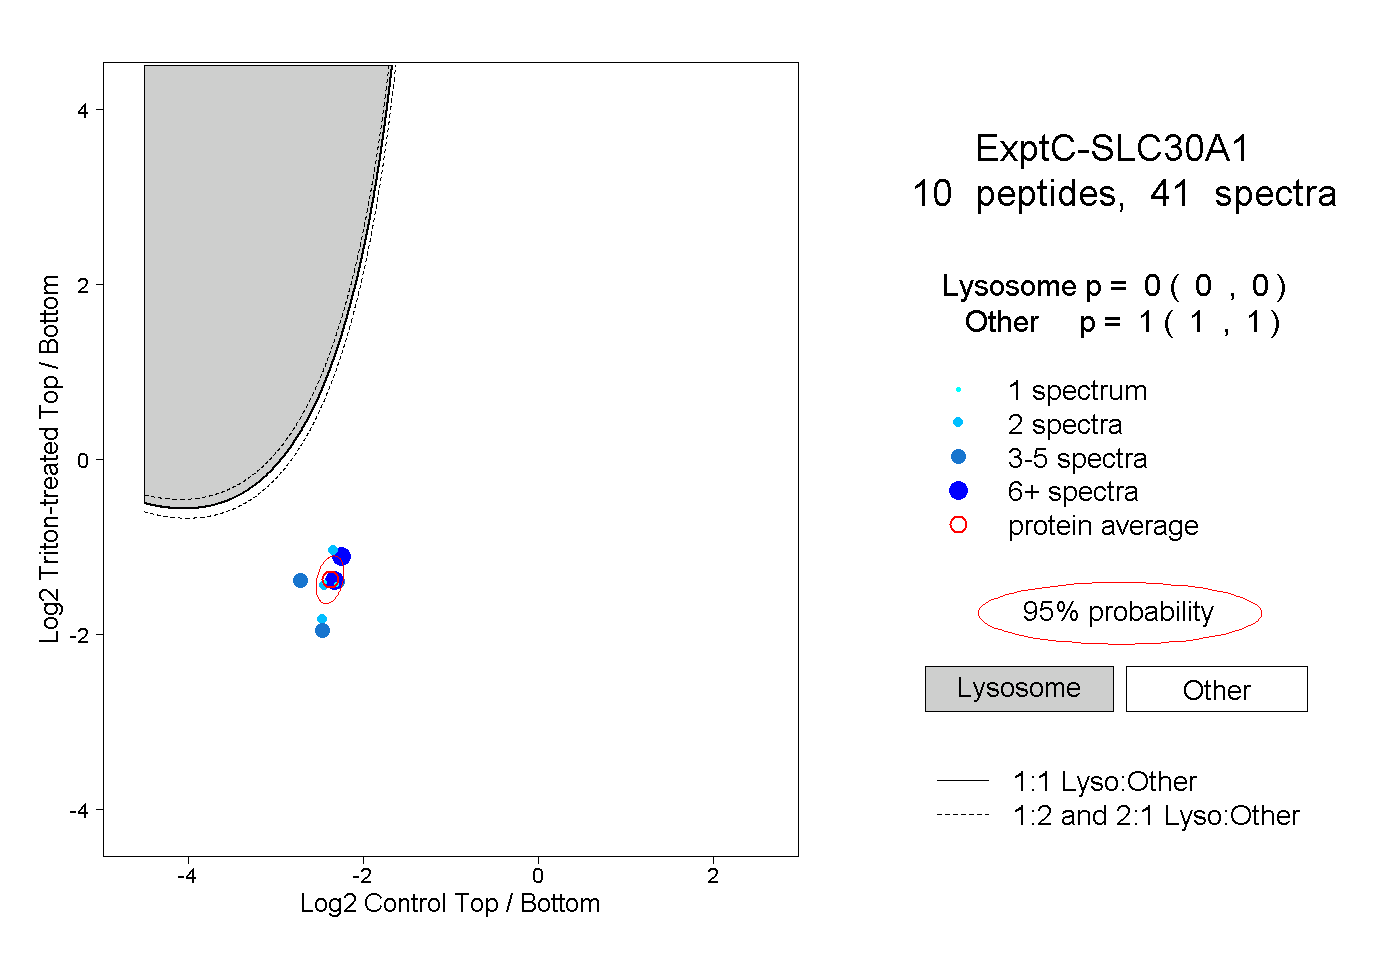
0.000 | 0.000
1.000 | 1.000
5peptides
spectra
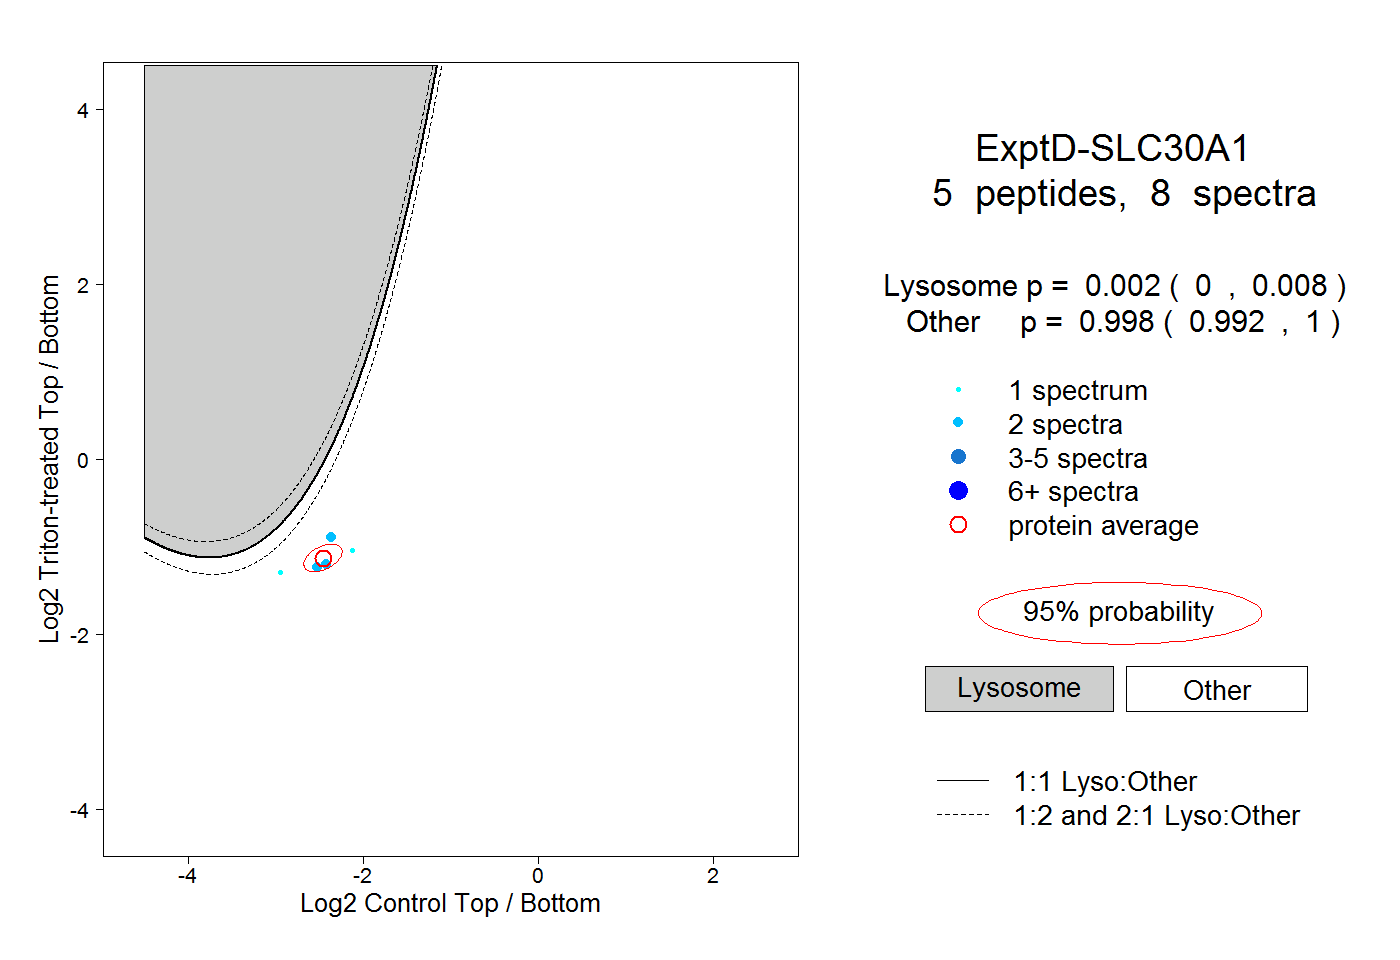
0.000 | 0.008
0.992 | 1.000