 12
12peptides
spectra
0.000 | 0.000
0.057 | 0.079
0.000 | 0.013
0.068 | 0.099
0.000 | 0.000
0.824 | 0.862
0.000 | 0.000
0.000 | 0.000
| Plot | Mito | Lyso | Perox | ER | Golgi | PM | Cytosol | Nucleus | |||||
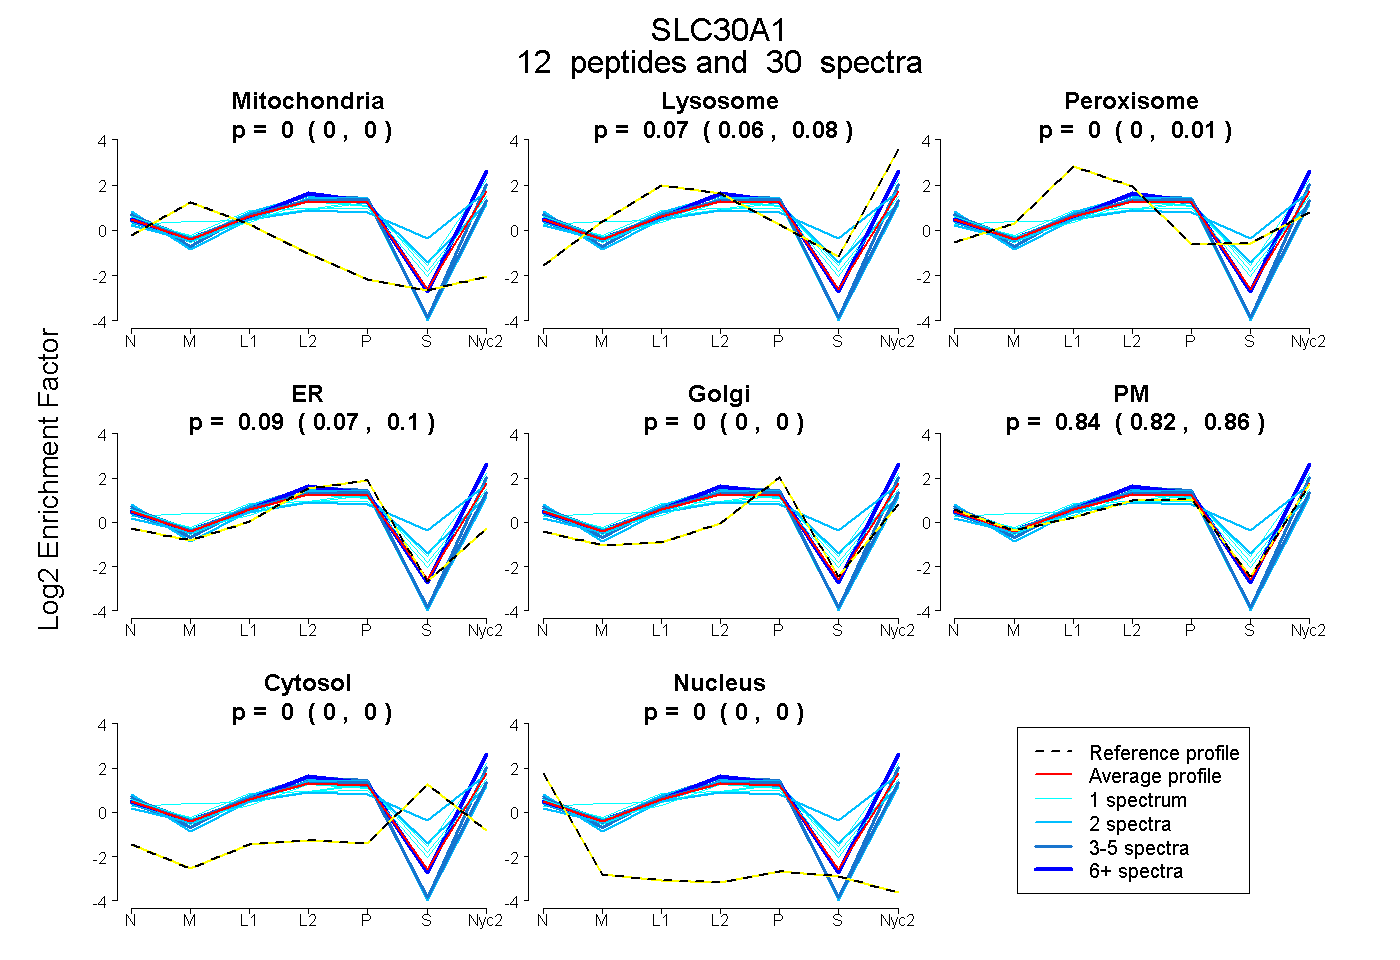
| Expt A |
12 peptides |
30 spectra |
|
0.000 0.000 | 0.000 |
0.071 0.057 | 0.079 |
0.000 0.000 | 0.013 |
0.087 0.068 | 0.099 |
0.000 0.000 | 0.000 |
0.842 0.824 | 0.862 |
0.000 0.000 | 0.000 |
0.000 0.000 | 0.000 |
| 1 spectrum, TQCALK | 0.000 | 0.000 | 0.092 | 0.057 | 0.000 | 0.850 | 0.001 | 0.000 | ||
| 4 spectra, SSVVPCELACR | 0.000 | 0.000 | 0.000 | 0.221 | 0.000 | 0.779 | 0.000 | 0.000 | ||
| 8 spectra, NTFGWIR | 0.000 | 0.168 | 0.000 | 0.000 | 0.000 | 0.832 | 0.000 | 0.000 | ||
| 1 spectrum, AEGSVPAVVIEIK | 0.020 | 0.000 | 0.000 | 0.000 | 0.000 | 0.980 | 0.000 | 0.000 | ||
| 2 spectra, THATQK | 0.000 | 0.212 | 0.100 | 0.000 | 0.000 | 0.497 | 0.192 | 0.000 | ||
| 1 spectrum, ESALILLQTVPK | 0.000 | 0.188 | 0.000 | 0.000 | 0.000 | 0.789 | 0.023 | 0.000 | ||
| 2 spectra, CEDPASYMQVAK | 0.000 | 0.004 | 0.247 | 0.187 | 0.000 | 0.550 | 0.013 | 0.000 | ||
| 2 spectra, QCCGTRPQVHSGK | 0.000 | 0.000 | 0.000 | 0.323 | 0.000 | 0.677 | 0.000 | 0.000 | ||
| 4 spectra, AGGEAGAPPGR | 0.000 | 0.000 | 0.000 | 0.046 | 0.000 | 0.954 | 0.000 | 0.000 | ||
| 3 spectra, AGQLNMR | 0.000 | 0.163 | 0.000 | 0.000 | 0.000 | 0.837 | 0.000 | 0.000 | ||
| 1 spectrum, APTVSISCLELSENLEK | 0.000 | 0.000 | 0.298 | 0.016 | 0.135 | 0.525 | 0.026 | 0.000 | ||
| 1 spectrum, ADQAEPEK | 0.000 | 0.021 | 0.156 | 0.000 | 0.180 | 0.643 | 0.000 | 0.000 |
| Plot | Mito | Lyso or Perox | ER | Golgi | PM | Cytosol | Nucleus | ||||||
| Expt B |
5 peptides |
6 spectra |
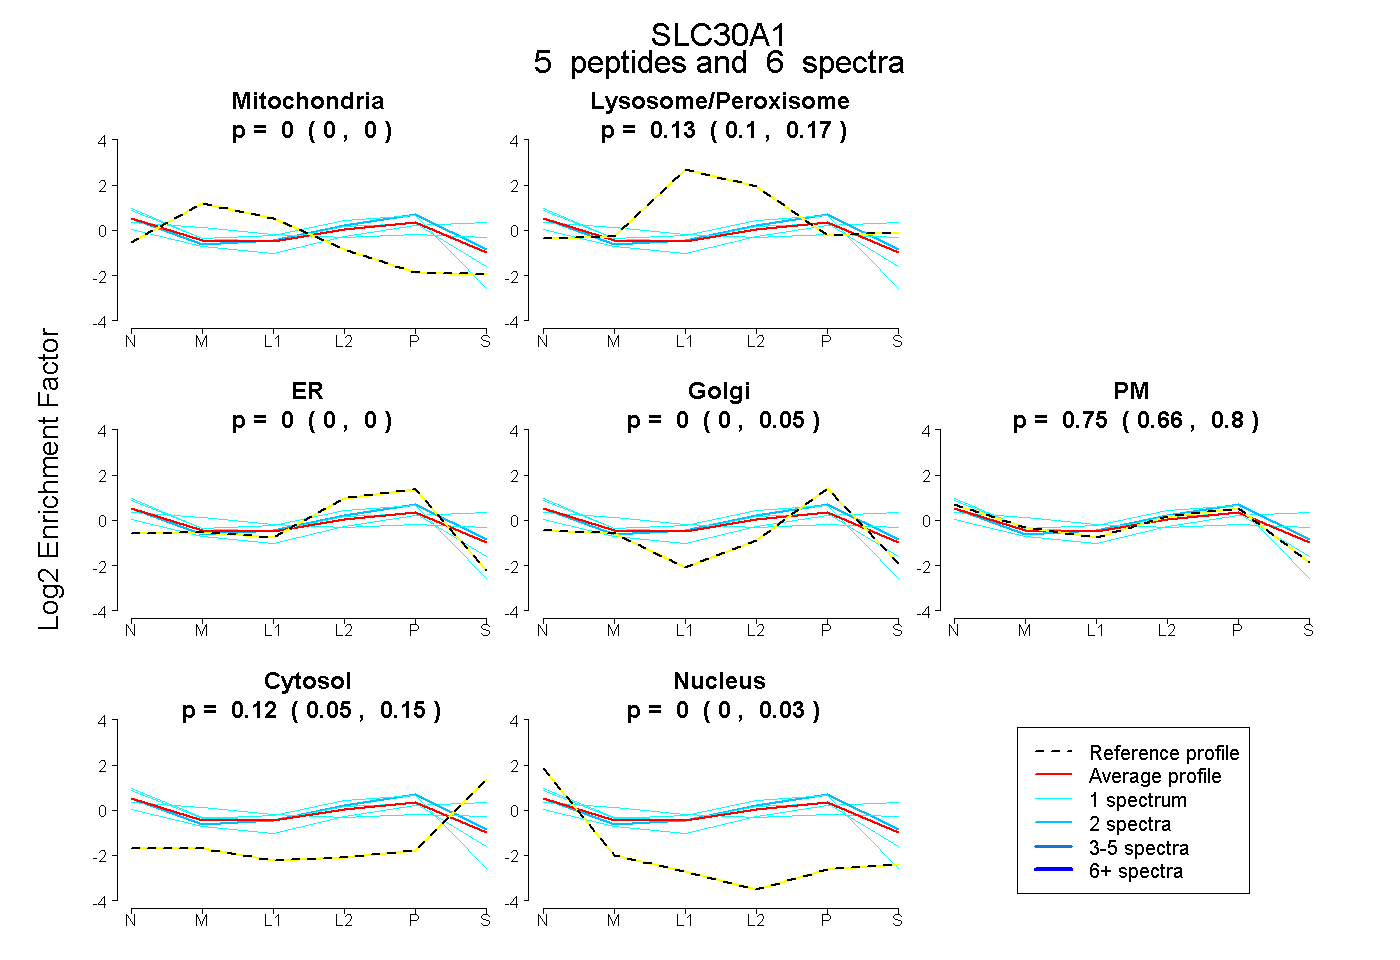 |
0.000 0.000 | 0.000 |
0.132 0.099 | 0.172 |
0.000 0.000 | 0.000 |
0.000 0.000 | 0.045 |
0.753 0.662 | 0.799 |
0.115 0.047 | 0.153 |
0.000 0.000 | 0.028 |
|||
| Plot | Lyso | Other | |||||||||||
| Expt C |
10 peptides |
41 spectra |
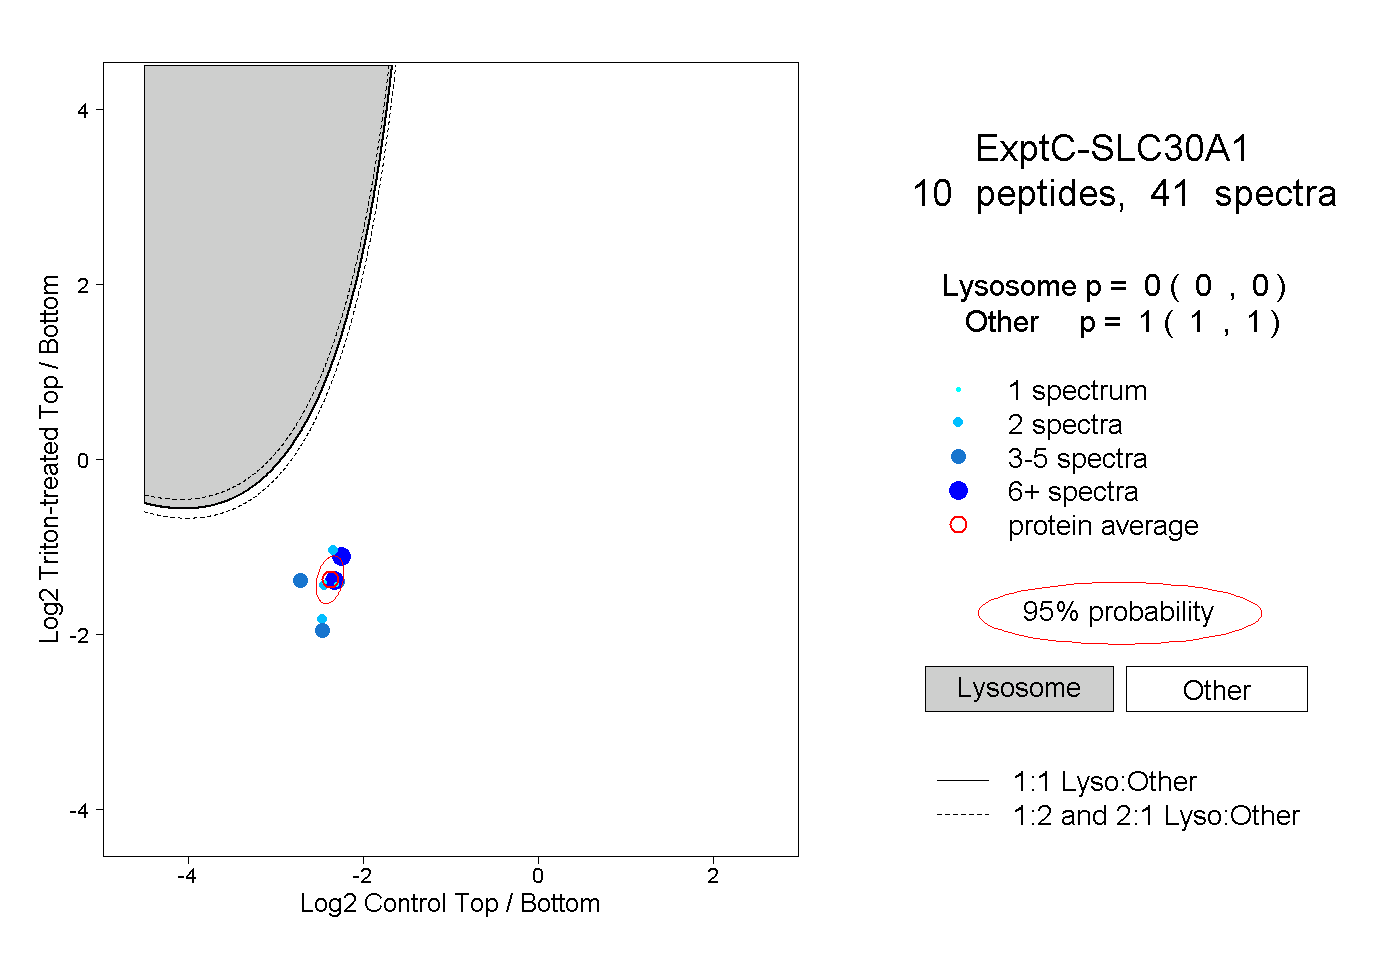 |
0.000 0.000 | 0.000 |
1.000 1.000 | 1.000 |
||||||||
| Plot | Lyso | Other | |||||||||||
| Expt D |
5 peptides |
8 spectra |
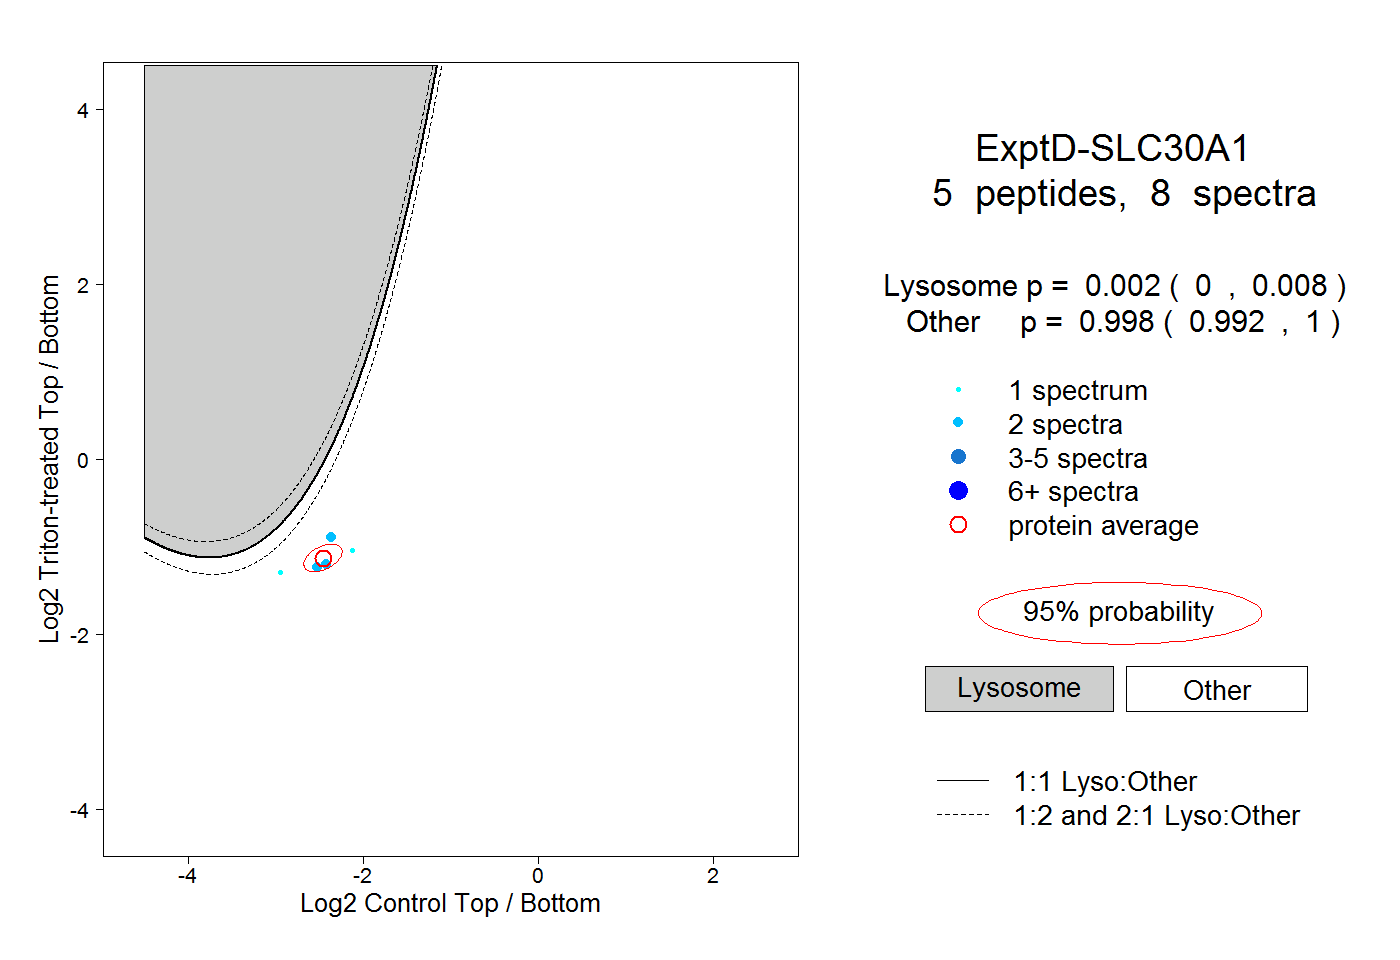 |
0.002 0.000 | 0.008 |
0.998 0.992 | 1.000 |