 9
9peptides
spectra
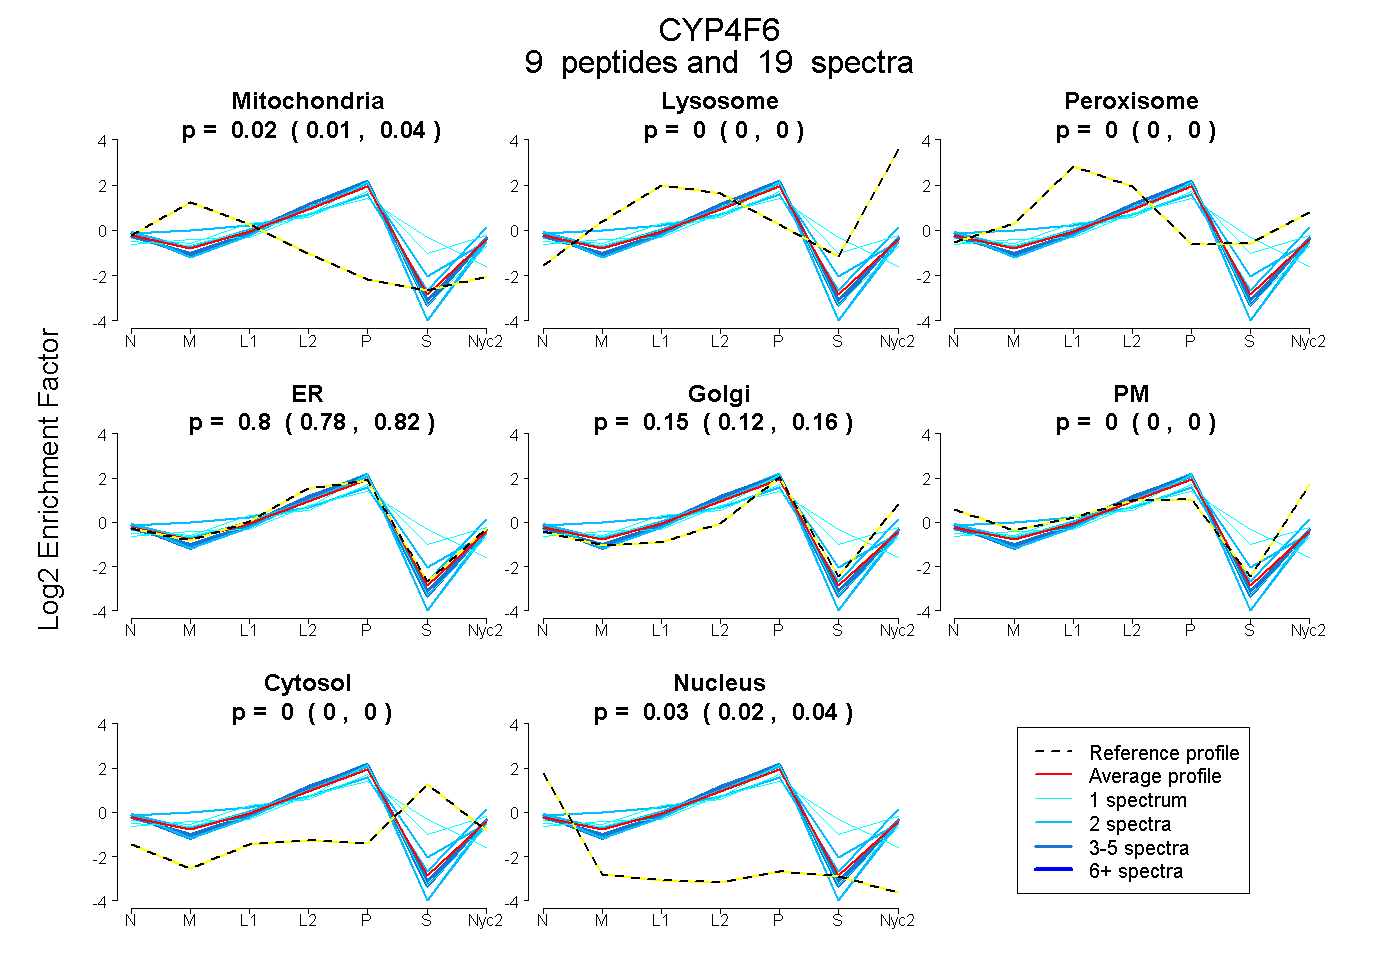
0.010 | 0.035
0.000 | 0.000
0.000 | 0.000
0.779 | 0.822
0.122 | 0.165
0.000 | 0.000
0.000 | 0.000
0.019 | 0.035
2peptides
spectra
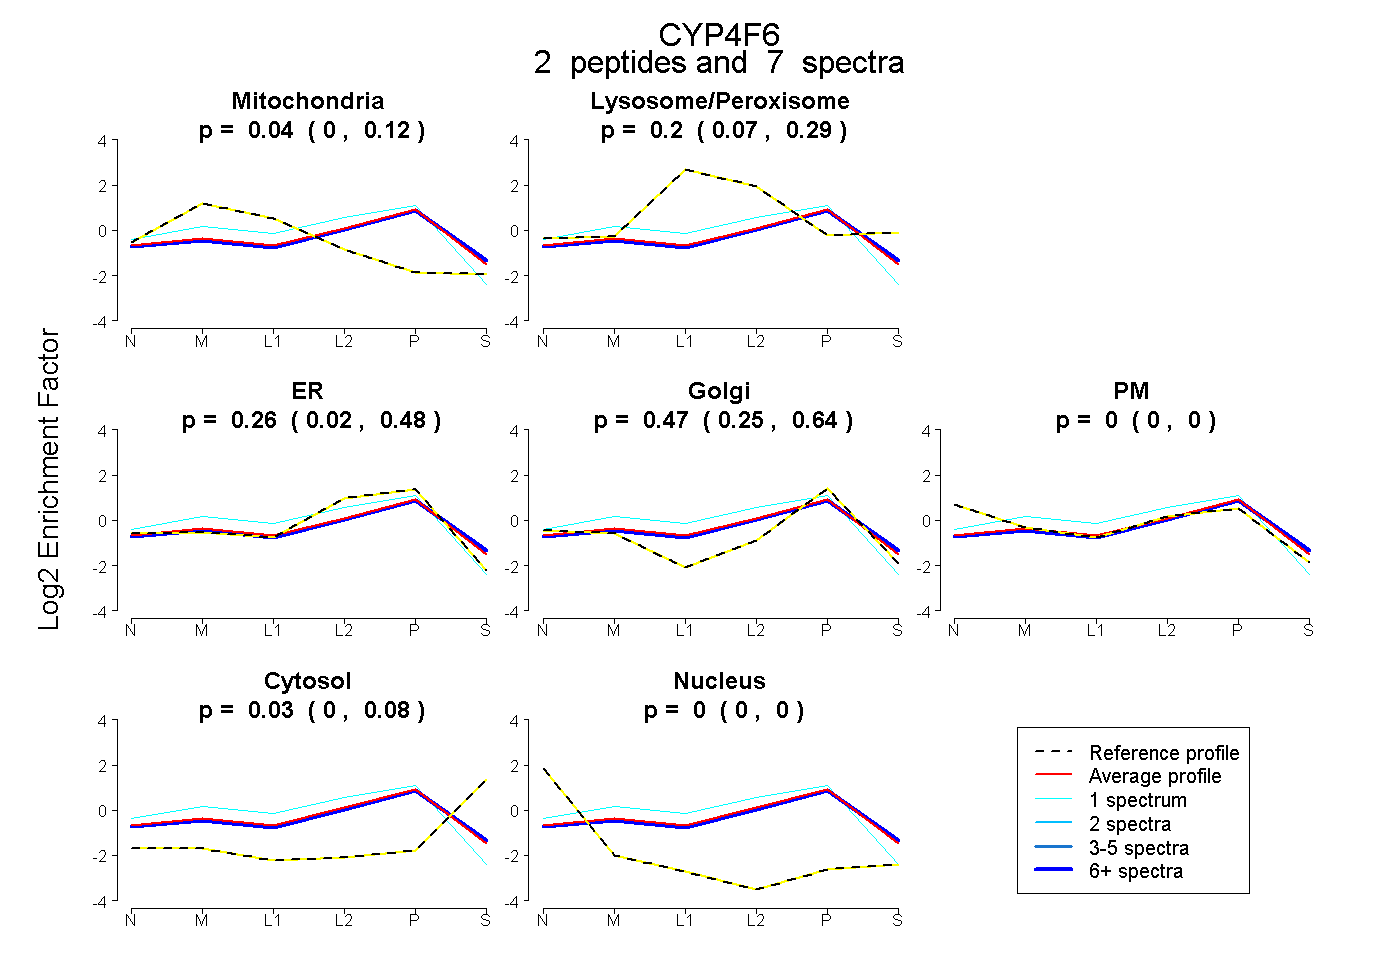
0.000 | 0.121
0.068 | 0.286
0.016 | 0.480
0.249 | 0.640
0.000 | 0.000
0.000 | 0.084
0.000 | 0.000
6peptides
spectra
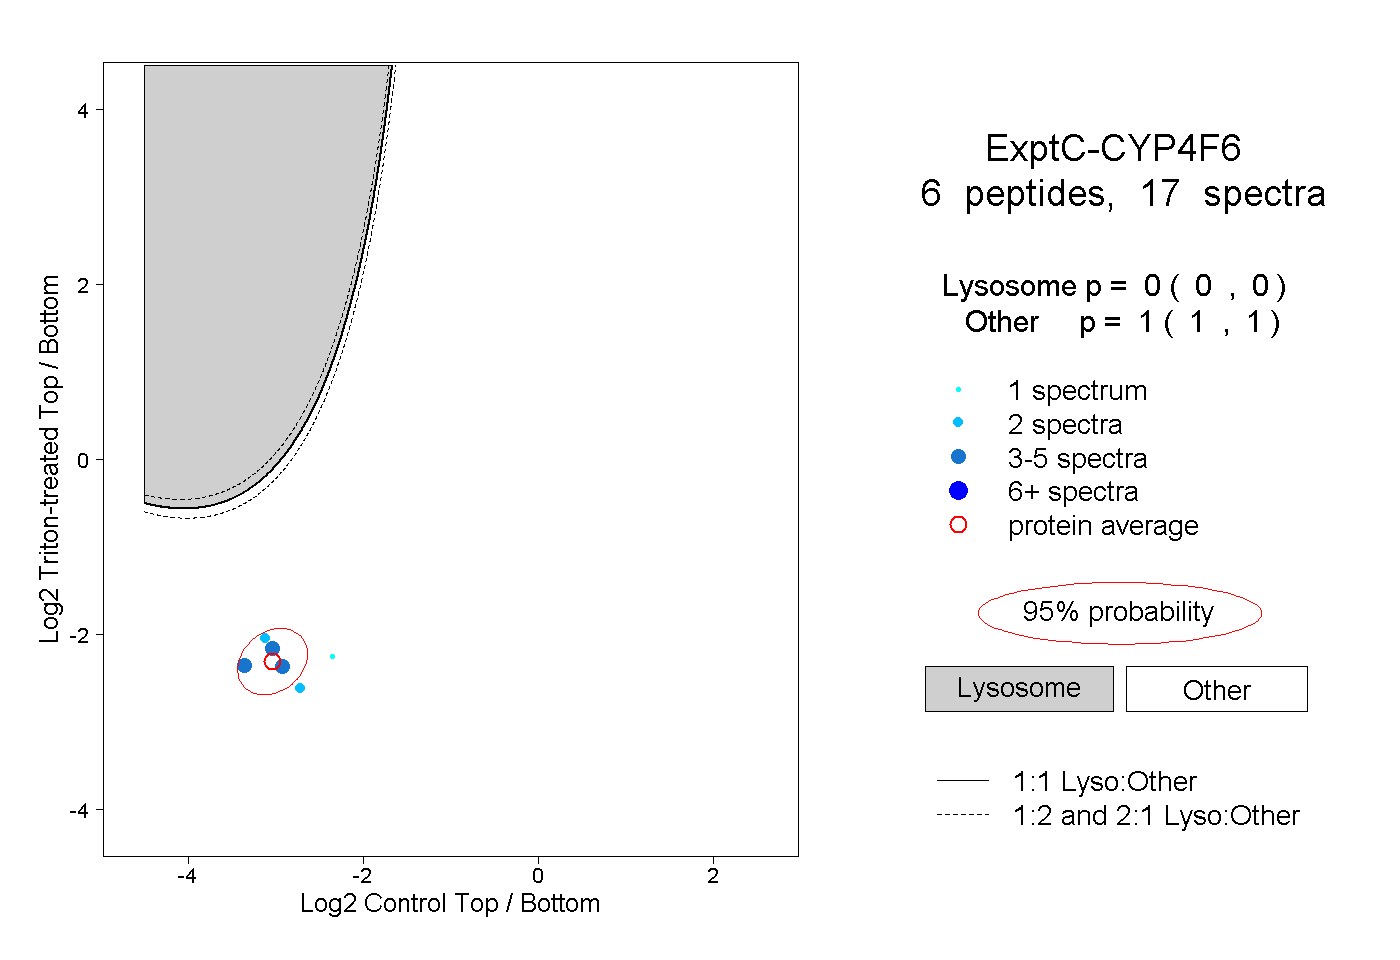
0.000 | 0.000
1.000 | 1.000
1peptide
spectrum
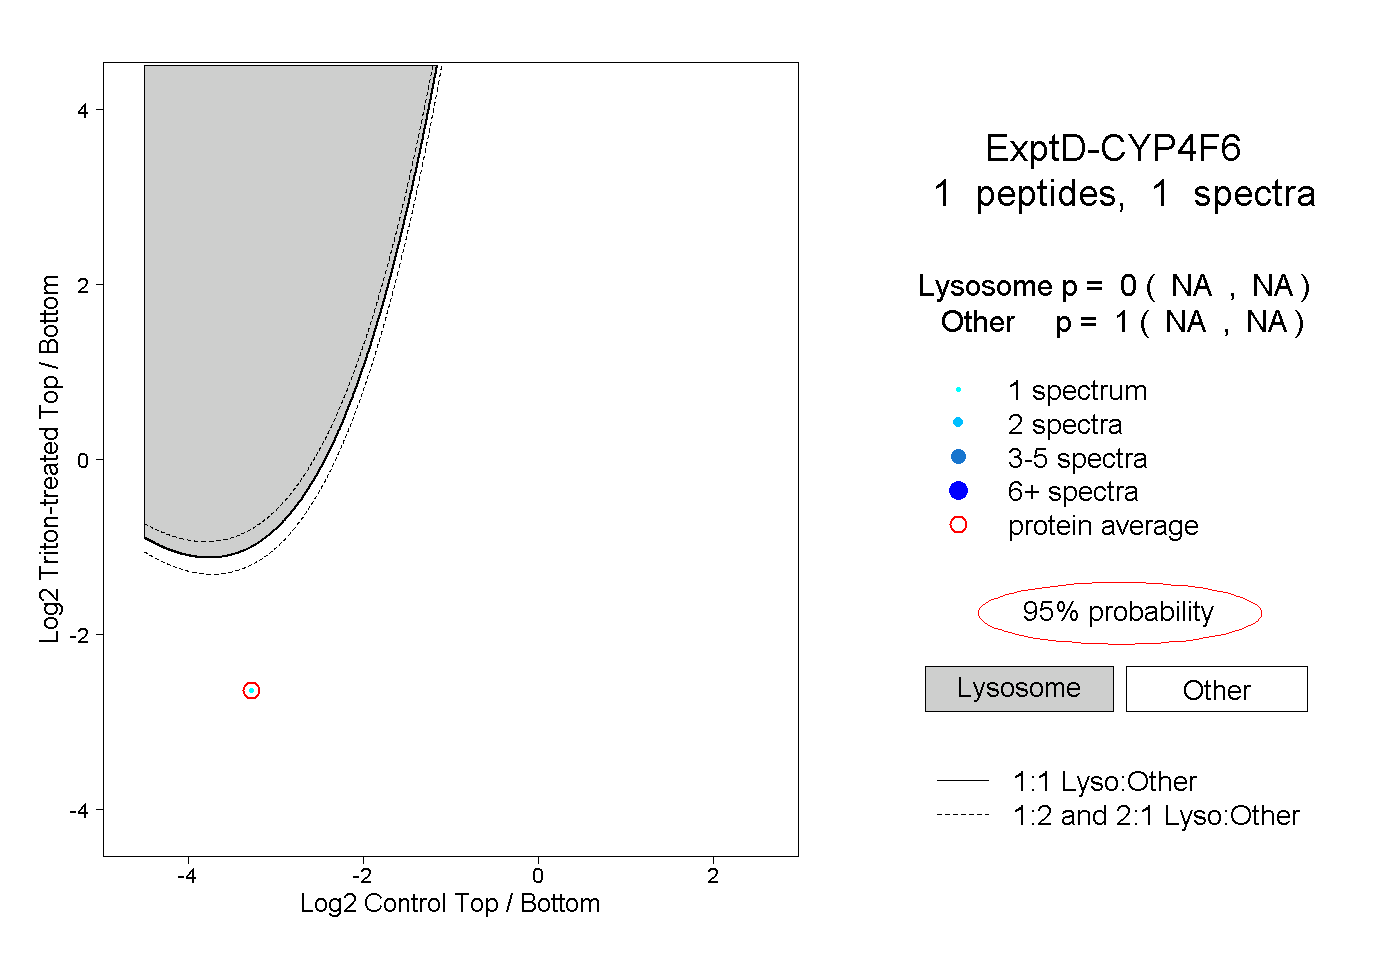
NA | NA
NA | NA