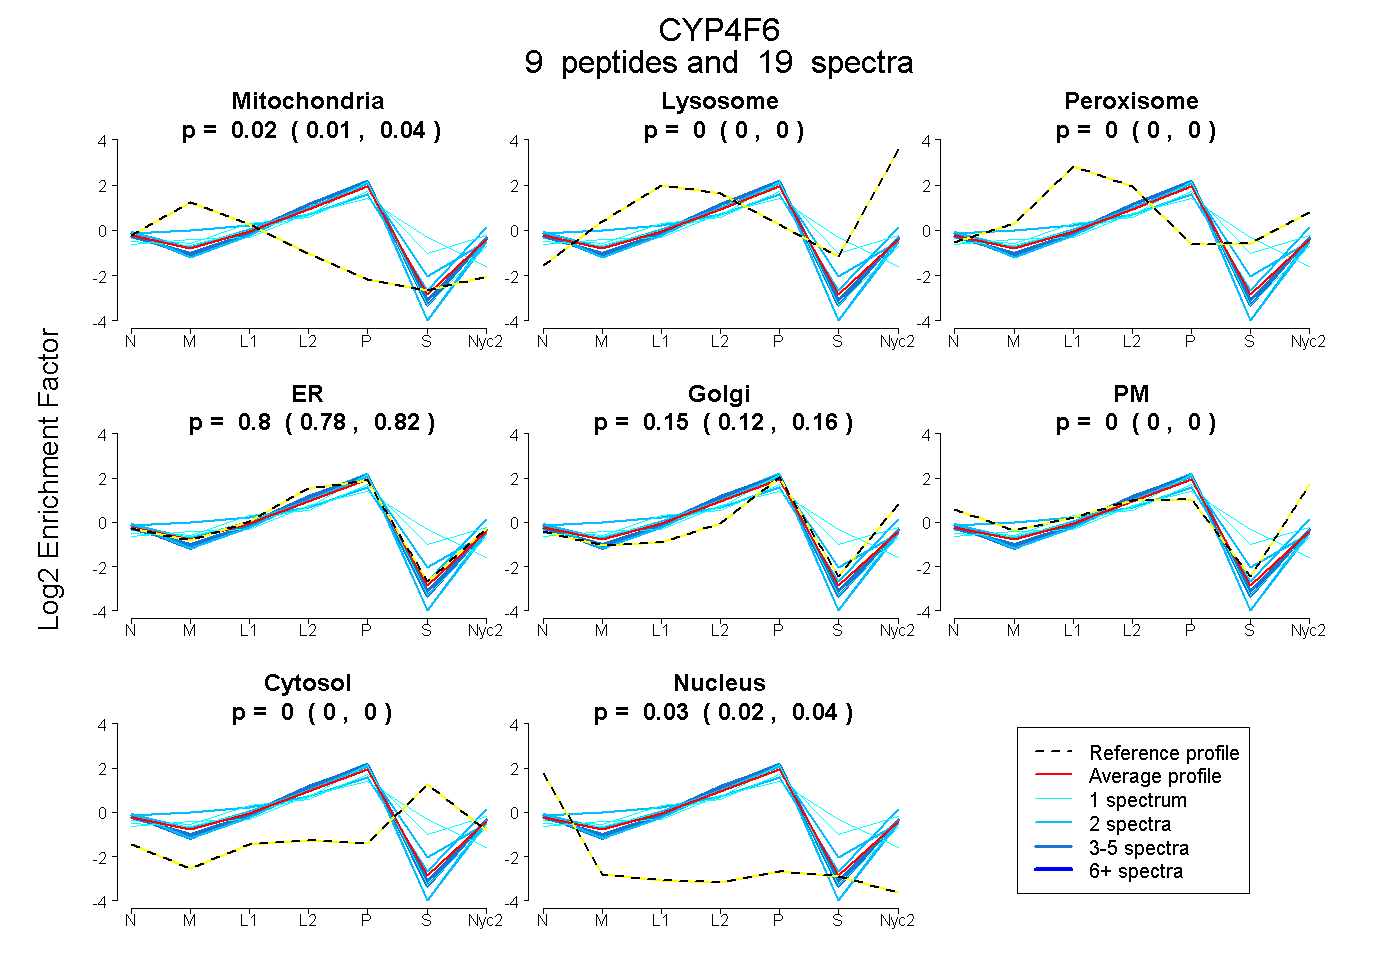
 9
9peptides
spectra
0.010 | 0.035
0.000 | 0.000
0.000 | 0.000
0.779 | 0.822
0.122 | 0.165
0.000 | 0.000
0.000 | 0.000
0.019 | 0.035
| Plot | Mito | Lyso | Perox | ER | Golgi | PM | Cytosol | Nucleus | |||||
| Expt A |
9 peptides |
19 spectra |
|
0.024 0.010 | 0.035 |
0.000 0.000 | 0.000 |
0.000 0.000 | 0.000 |
0.802 0.779 | 0.822 |
0.146 0.122 | 0.165 |
0.000 0.000 | 0.000 |
0.000 0.000 | 0.000 |
0.028 0.019 | 0.035 |
| 2 spectra, FDPENPQK | 0.126 | 0.037 | 0.000 | 0.515 | 0.155 | 0.167 | 0.000 | 0.000 | ||
| 3 spectra, LLTPAFHFDILK | 0.000 | 0.000 | 0.000 | 0.870 | 0.103 | 0.000 | 0.000 | 0.027 | ||
| 1 spectrum, LDMFEHISLMTLDSLQK | 0.000 | 0.000 | 0.182 | 0.419 | 0.255 | 0.000 | 0.144 | 0.000 | ||
| 1 spectrum, NNEEGMQFIAHLGR | 0.041 | 0.000 | 0.026 | 0.615 | 0.000 | 0.000 | 0.318 | 0.000 | ||
| 5 spectra, LHPPVLLISR | 0.000 | 0.000 | 0.000 | 0.858 | 0.121 | 0.000 | 0.000 | 0.021 | ||
| 1 spectrum, SVNTMHAK | 0.049 | 0.000 | 0.000 | 0.790 | 0.140 | 0.000 | 0.000 | 0.022 | ||
| 2 spectra, STLNTQGVDEFLK | 0.000 | 0.000 | 0.000 | 0.800 | 0.092 | 0.000 | 0.082 | 0.026 | ||
| 2 spectra, GLSDVDIR | 0.000 | 0.000 | 0.000 | 0.941 | 0.014 | 0.000 | 0.000 | 0.045 | ||
| 2 spectra, MLQLSLSR | 0.000 | 0.000 | 0.000 | 0.909 | 0.057 | 0.000 | 0.000 | 0.034 |
| Plot | Mito | Lyso or Perox | ER | Golgi | PM | Cytosol | Nucleus | ||||||
| Expt B |
2 peptides |
7 spectra |
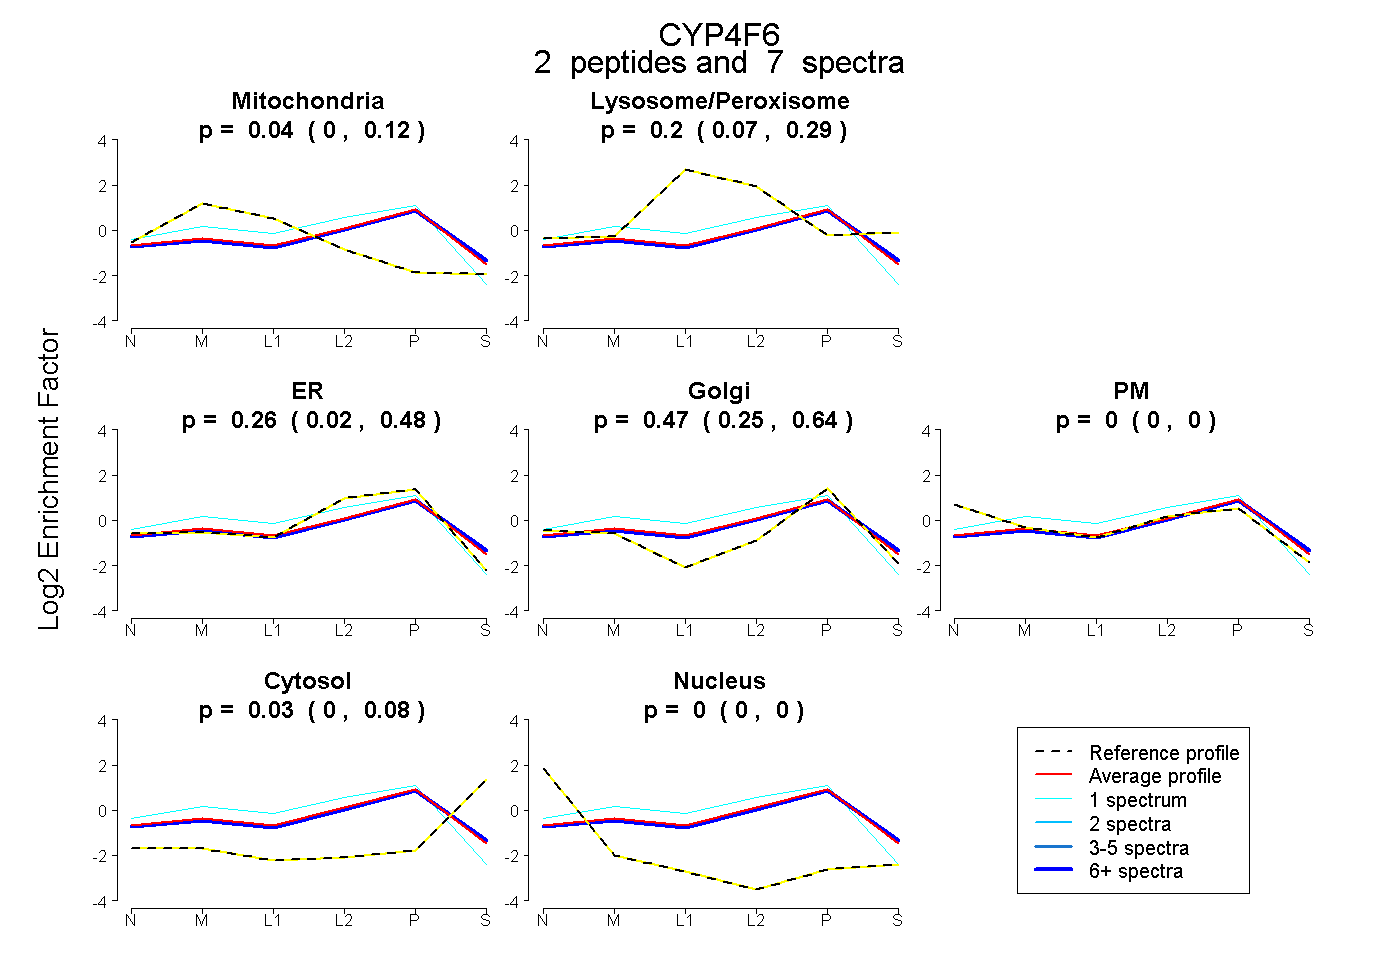 |
0.045 0.000 | 0.121 |
0.195 0.068 | 0.286 |
0.257 0.016 | 0.480 |
0.472 0.249 | 0.640 |
0.000 0.000 | 0.000 |
0.031 0.000 | 0.084 |
0.000 0.000 | 0.000 |
|||
| Plot | Lyso | Other | |||||||||||
| Expt C |
6 peptides |
17 spectra |
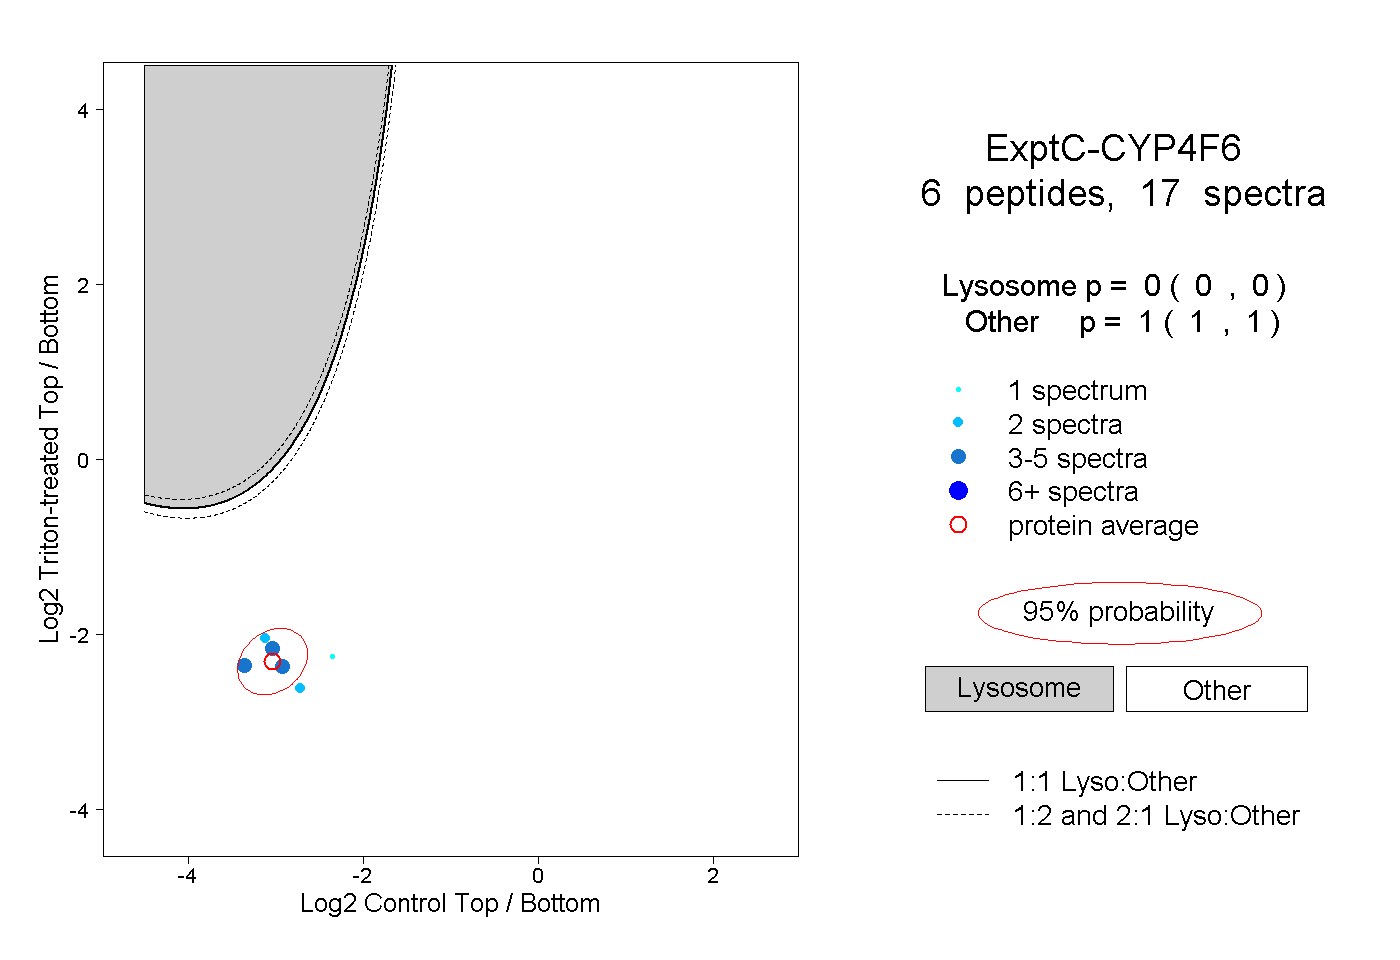 |
0.000 0.000 | 0.000 |
1.000 1.000 | 1.000 |
||||||||
| Plot | Lyso | Other | |||||||||||
| Expt D |
1 peptide |
1 spectrum |
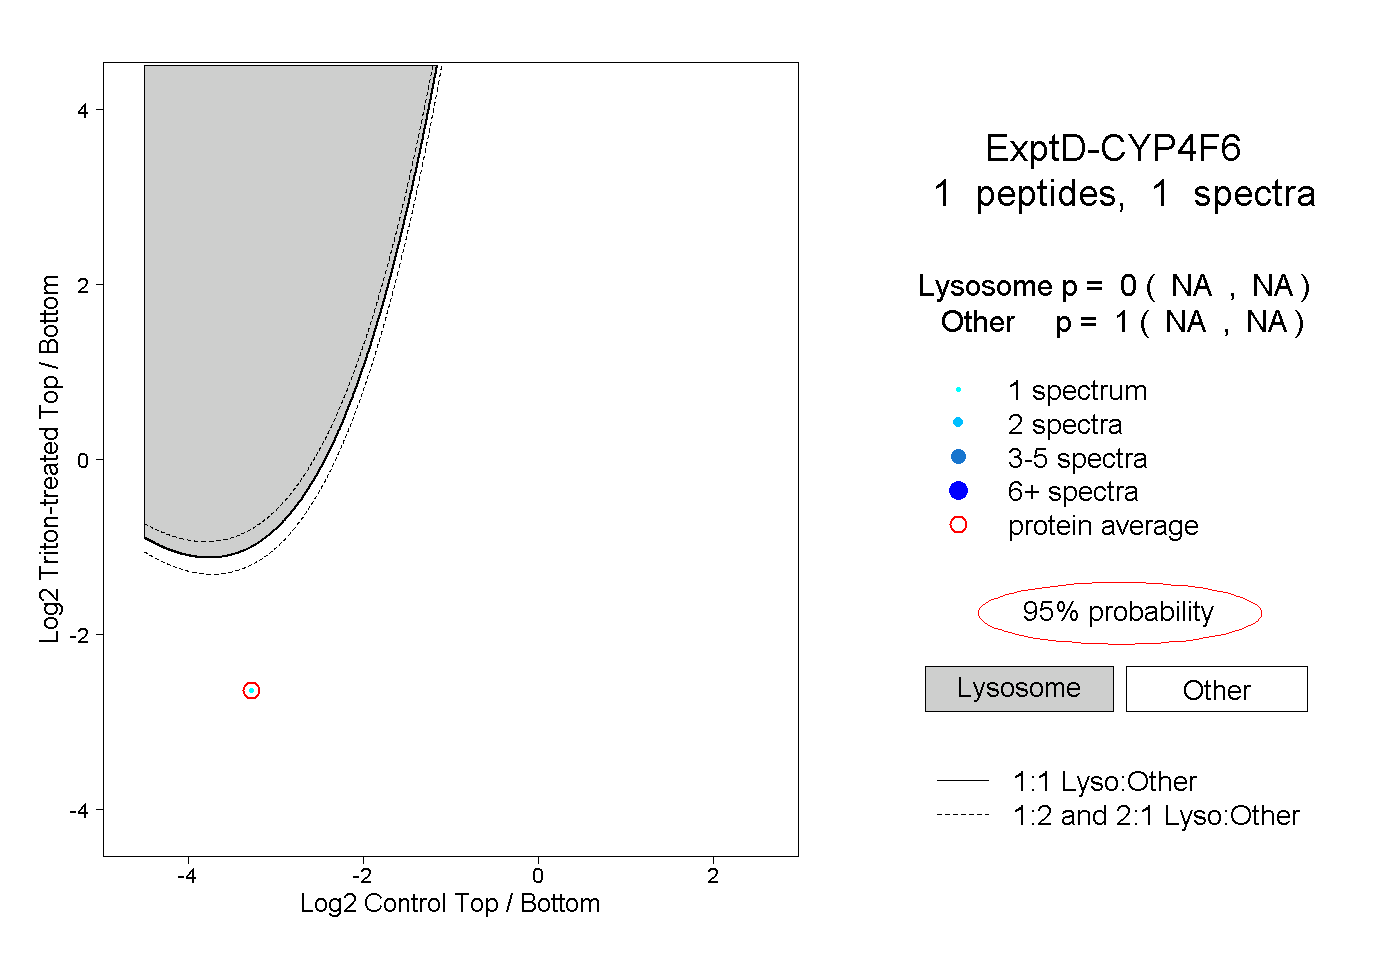 |
0.000 NA | NA |
1.000 NA | NA |