 3
3peptides
spectra
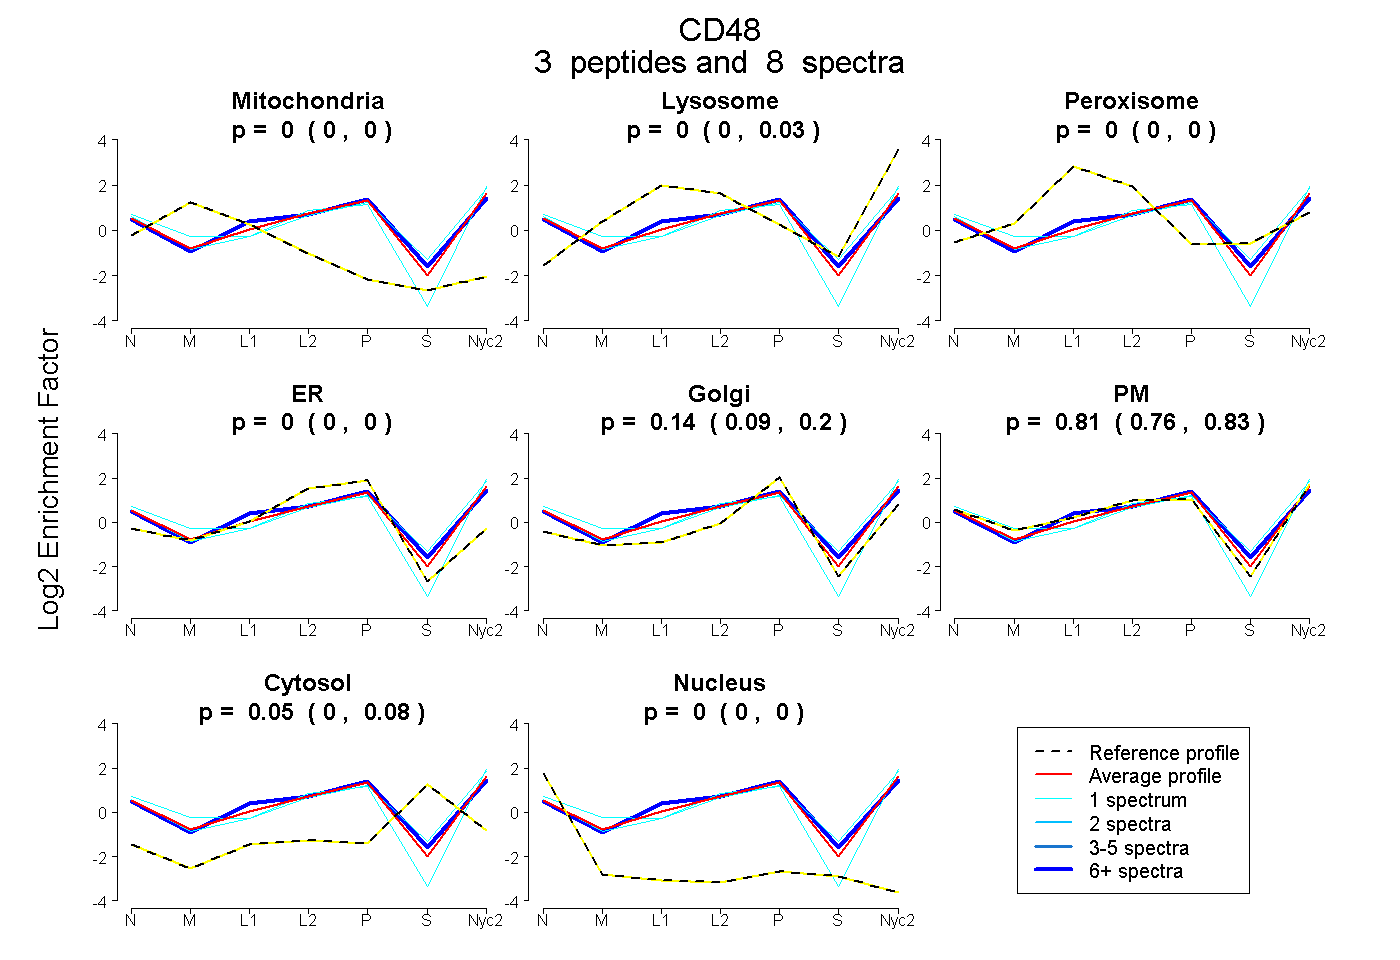
0.000 | 0.000
0.000 | 0.034
0.000 | 0.003
0.000 | 0.000
0.090 | 0.198
0.760 | 0.830
0.000 | 0.081
0.000 | 0.000
3peptides
spectra
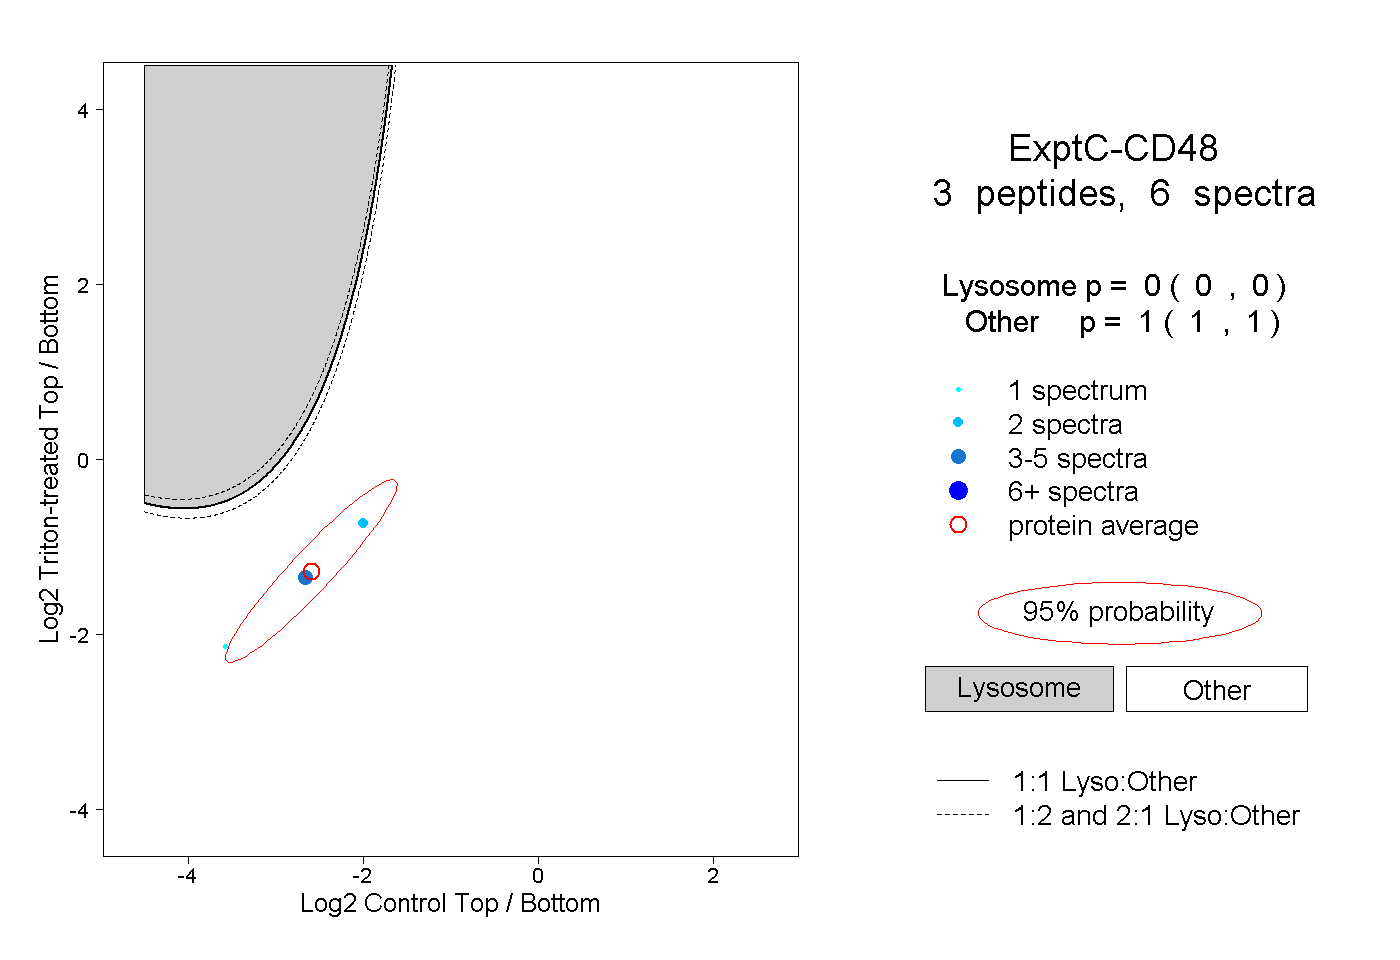
0.000 | 0.000
1.000 | 1.000
2peptides
spectra
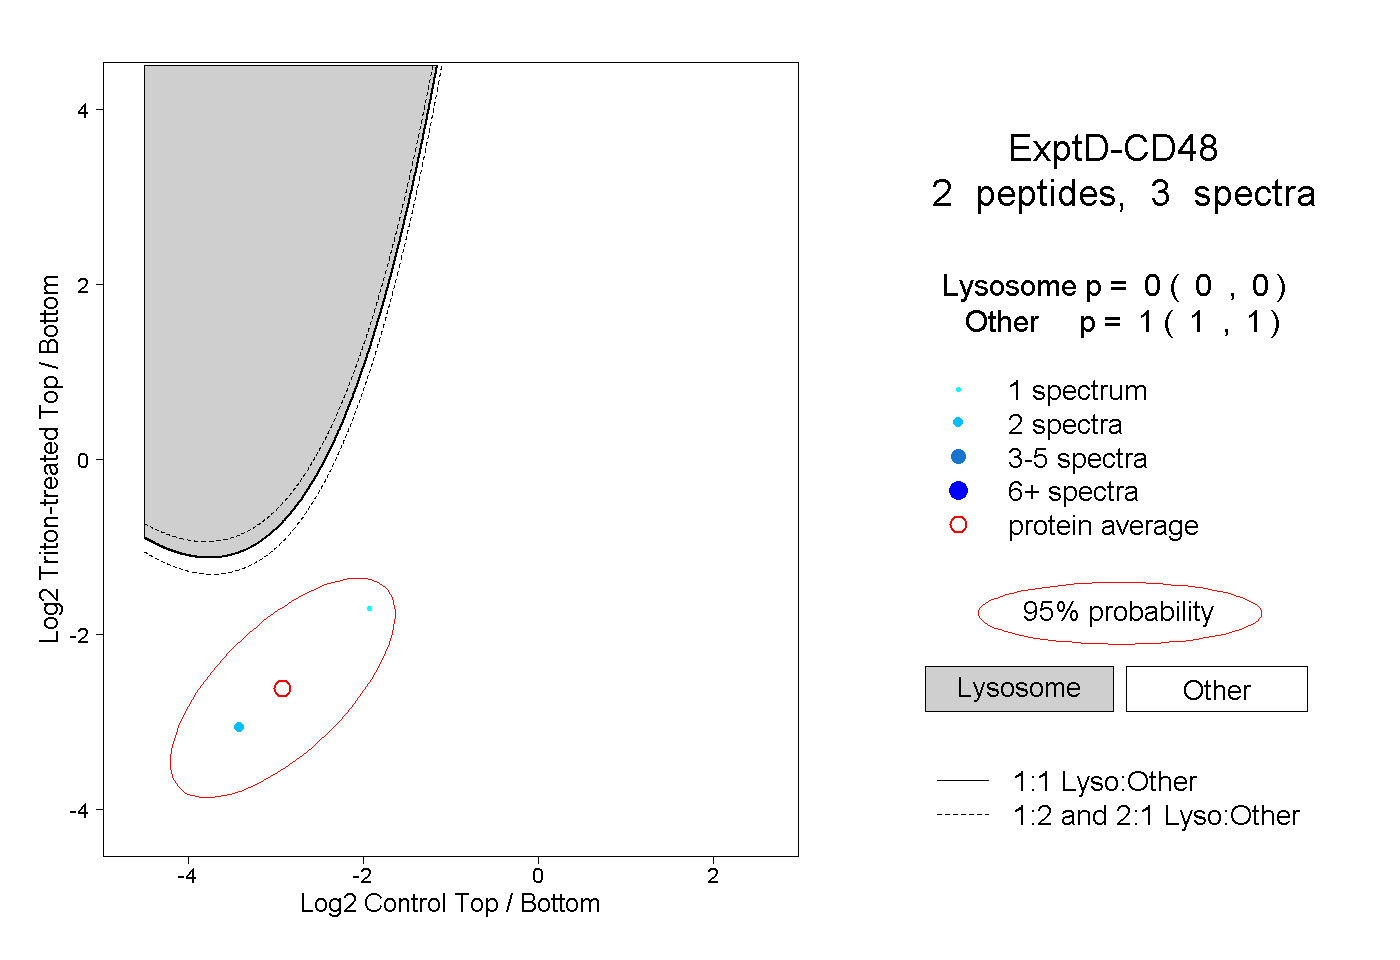
0.000 | 0.000
1.000 | 1.000