 3
3peptides
spectra
0.000 | 0.000
0.000 | 0.034
0.000 | 0.003
0.000 | 0.000
0.090 | 0.198
0.760 | 0.830
0.000 | 0.081
0.000 | 0.000
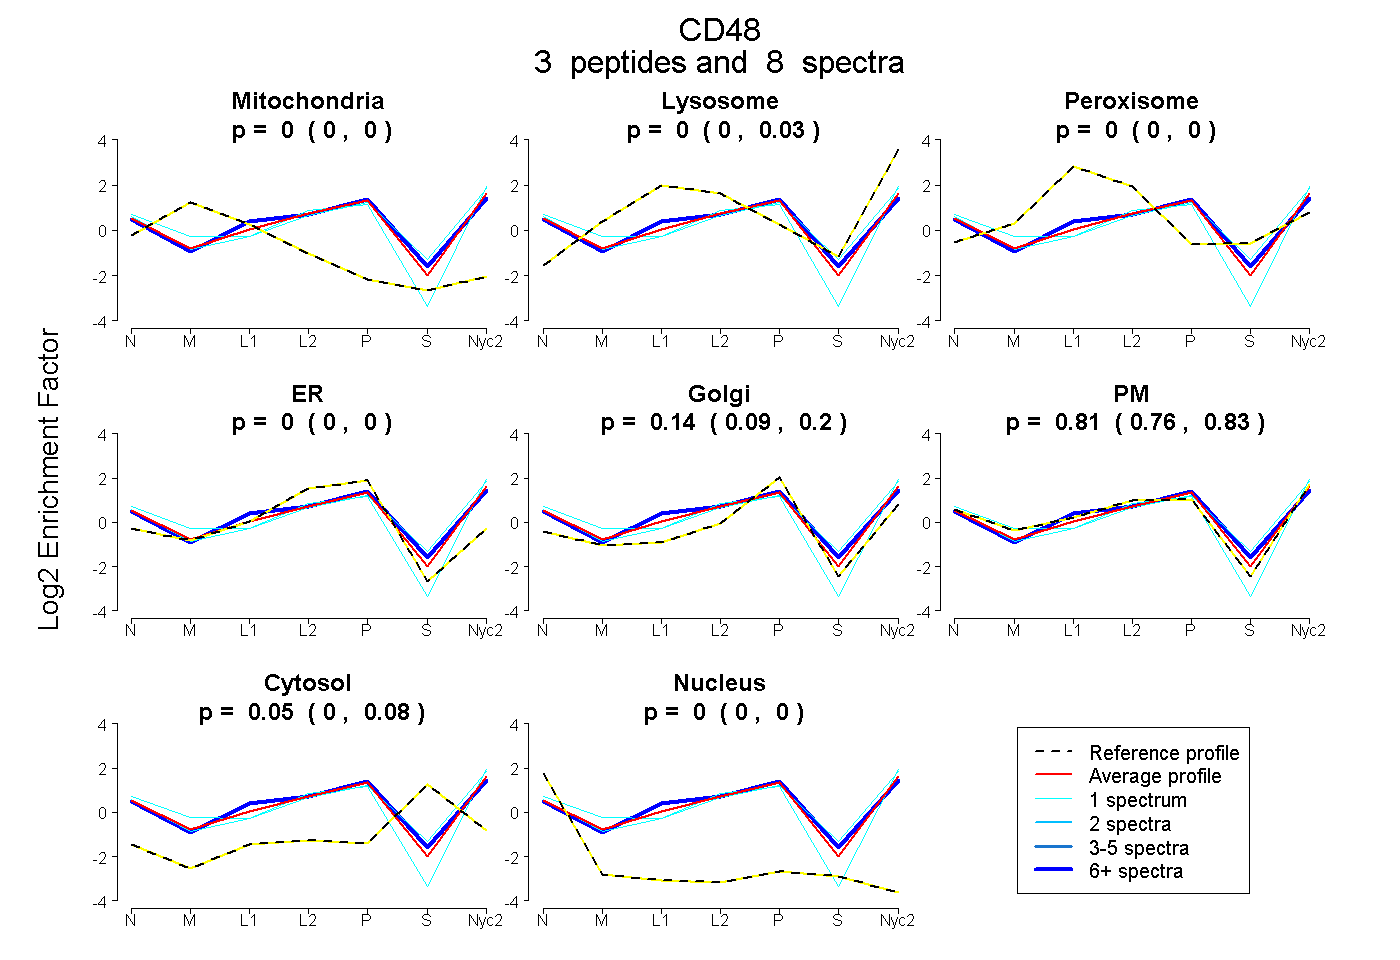
| Plot | Mito | Lyso | Perox | ER | Golgi | PM | Cytosol | Nucleus | |||||
| Expt A |
3 peptides |
8 spectra |
|
0.000 0.000 | 0.000 |
0.002 0.000 | 0.034 |
0.000 0.000 | 0.003 |
0.000 0.000 | 0.000 |
0.139 0.090 | 0.198 |
0.813 0.760 | 0.830 |
0.046 0.000 | 0.081 |
0.000 0.000 | 0.000 |
| 1 spectrum, TVFESVFK | 0.000 | 0.020 | 0.000 | 0.000 | 0.058 | 0.790 | 0.131 | 0.000 | ||
| 1 spectrum, ILEYFPNGK | 0.000 | 0.000 | 0.000 | 0.000 | 0.050 | 0.948 | 0.000 | 0.002 | ||
| 6 spectra, HPLASYQR | 0.000 | 0.000 | 0.094 | 0.000 | 0.186 | 0.658 | 0.062 | 0.000 |
| Plot | Lyso | Other | |||||||||||
| Expt C |
3 peptides |
6 spectra |
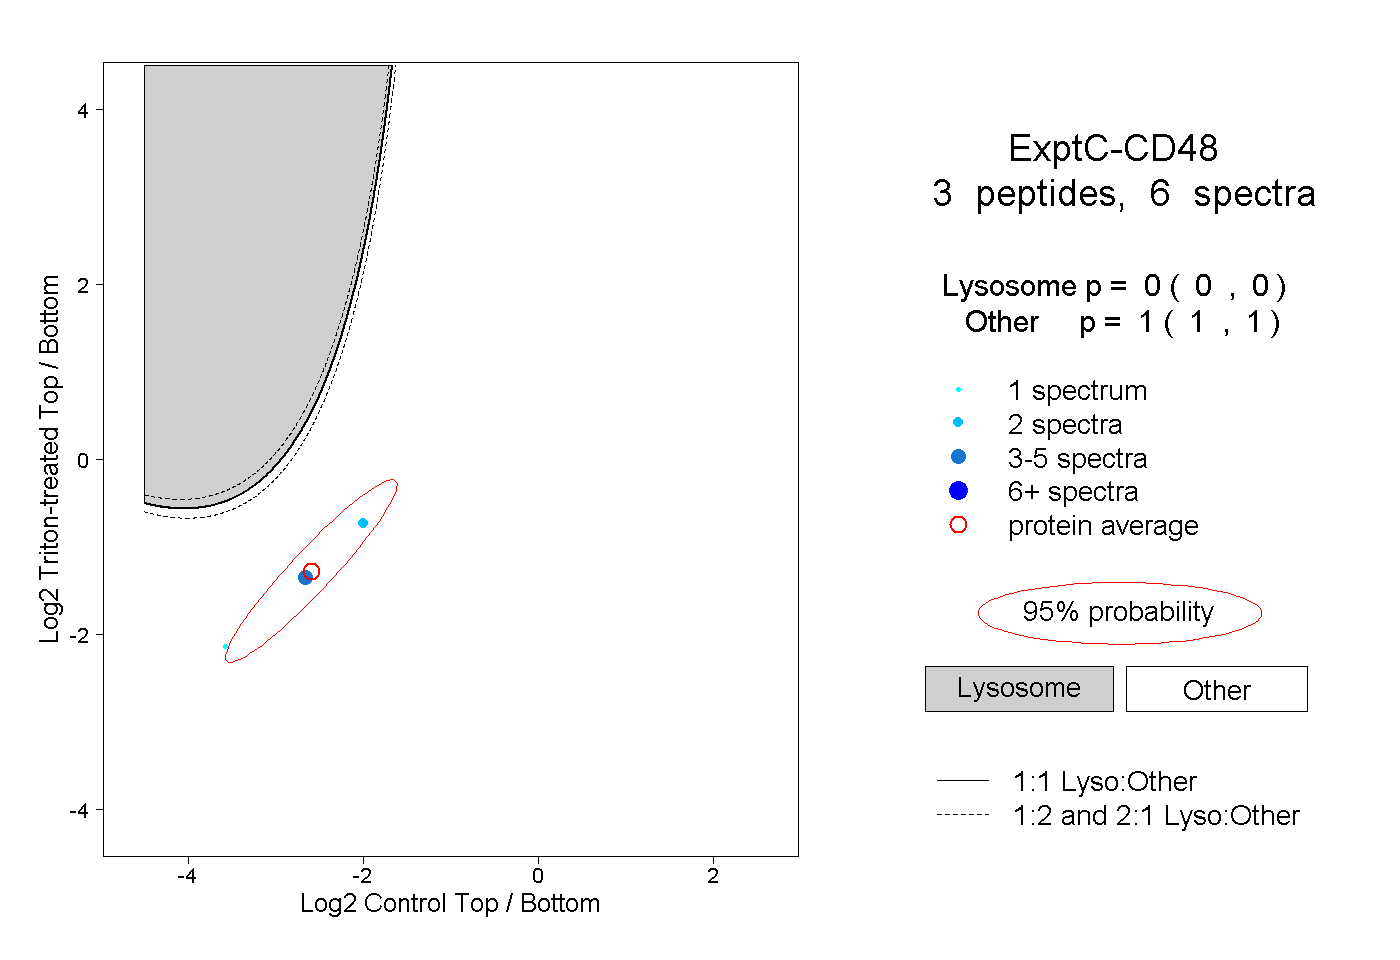 |
0.000 0.000 | 0.000 |
1.000 1.000 | 1.000 |
||||||||
| Plot | Lyso | Other | |||||||||||
| Expt D |
2 peptides |
3 spectra |
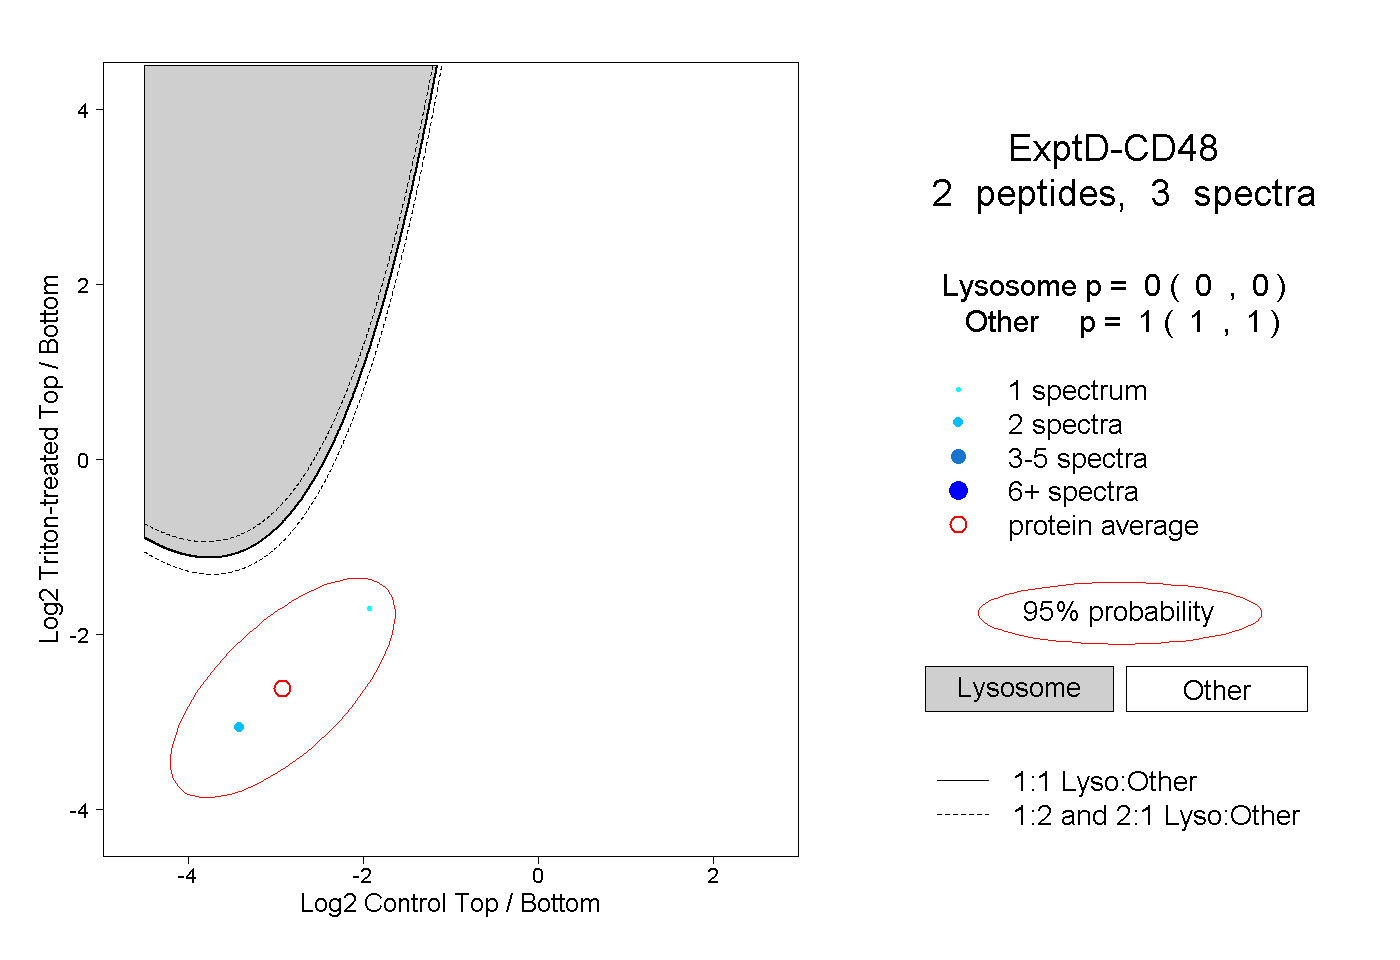 |
0.000 0.000 | 0.000 |
1.000 1.000 | 1.000 |