 7
7peptides
spectra
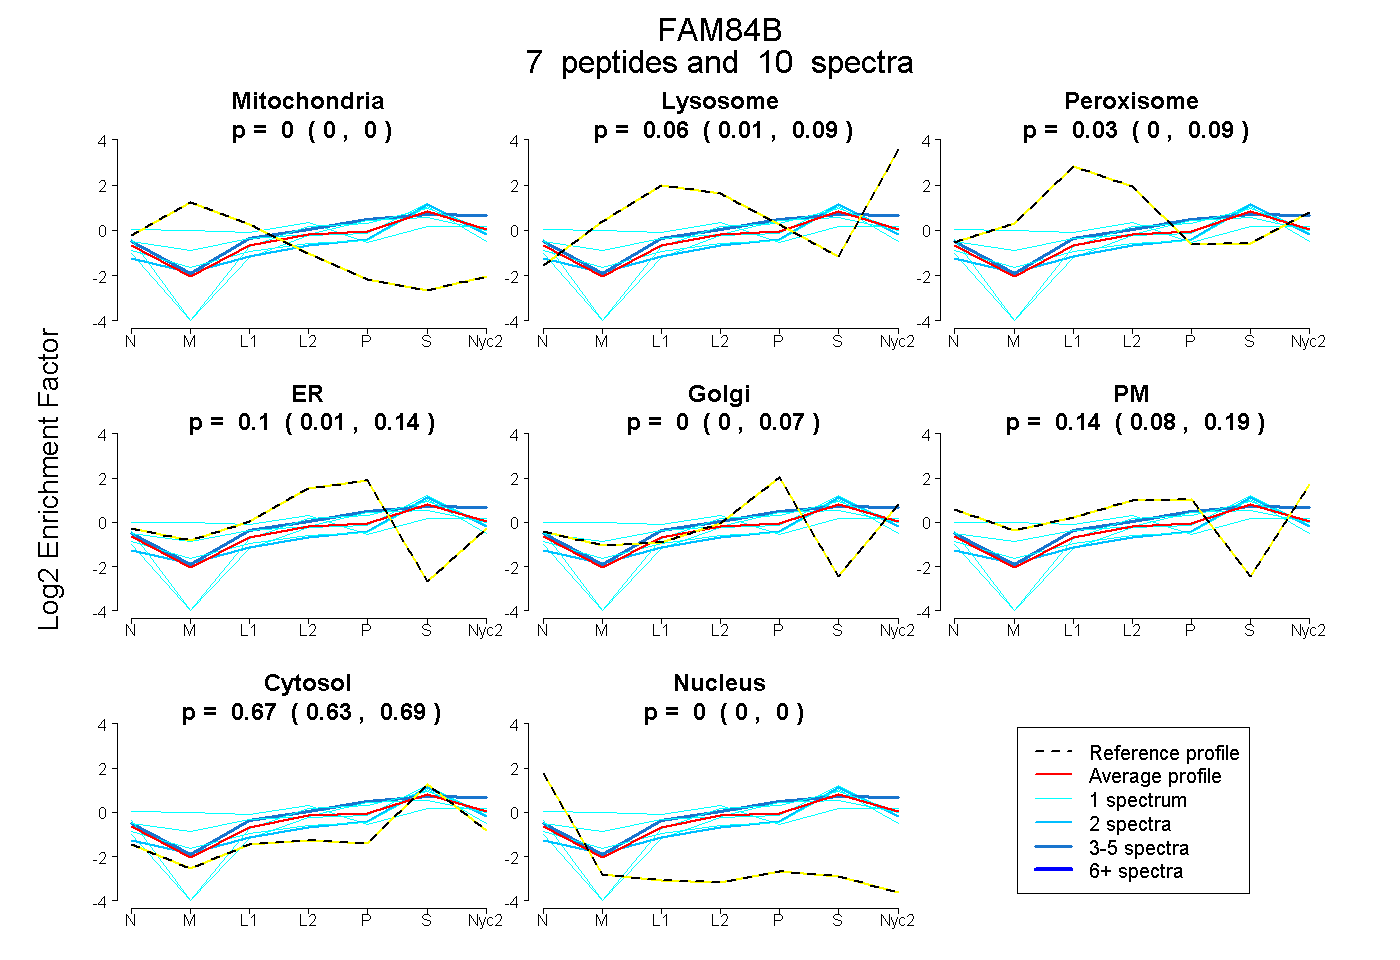
0.000 | 0.000
0.014 | 0.089
0.000 | 0.085
0.013 | 0.135
0.000 | 0.066
0.076 | 0.194
0.631 | 0.689
0.000 | 0.000
1peptide
spectrum
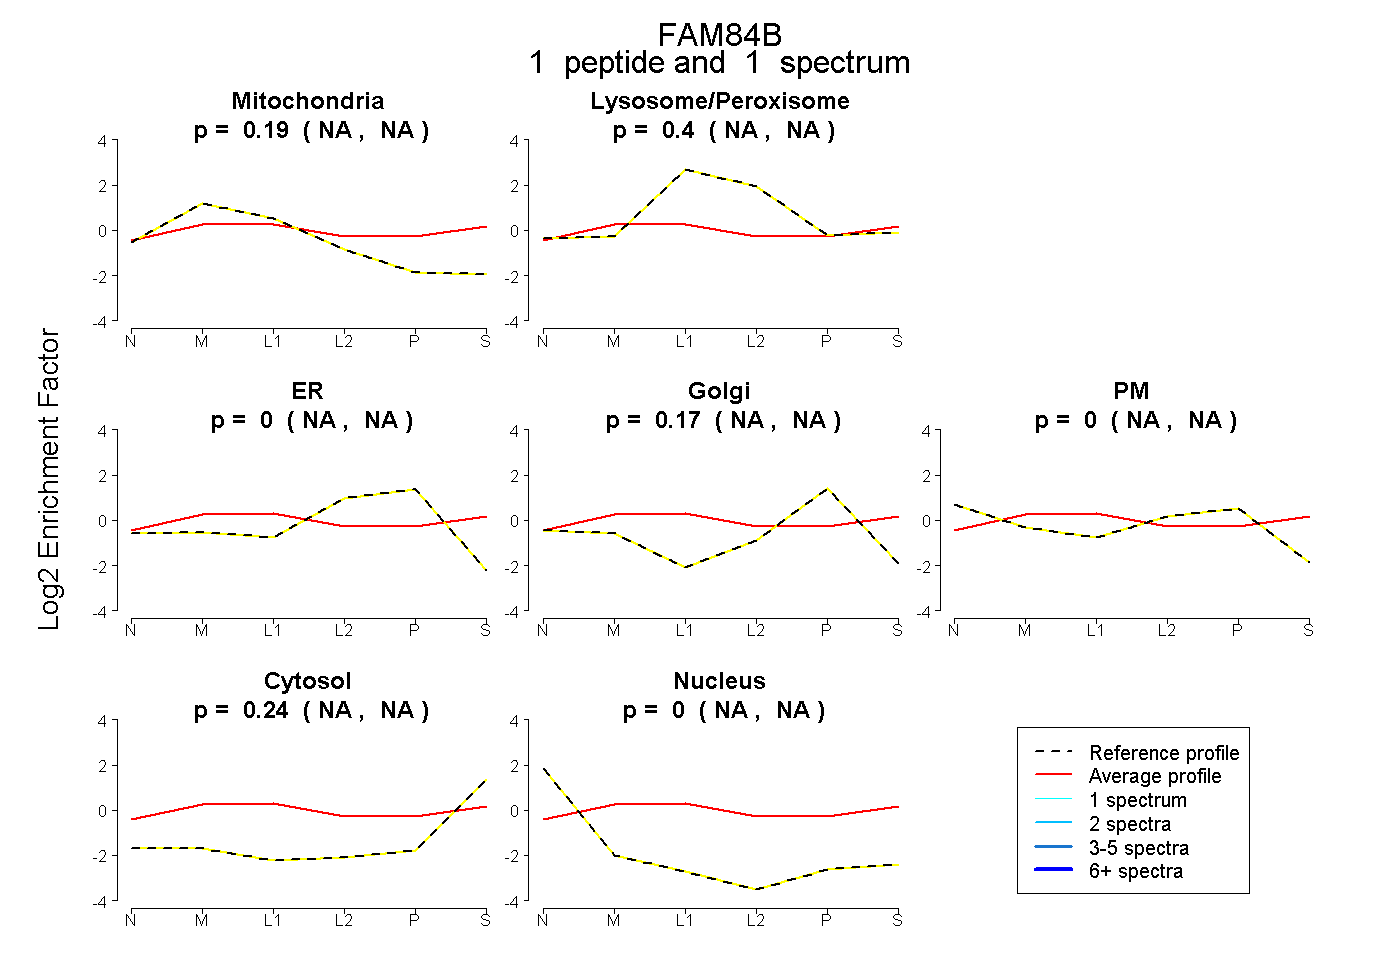
NA | NA
NA | NA
NA | NA
NA | NA
NA | NA
NA | NA
NA | NA
4peptides
spectra
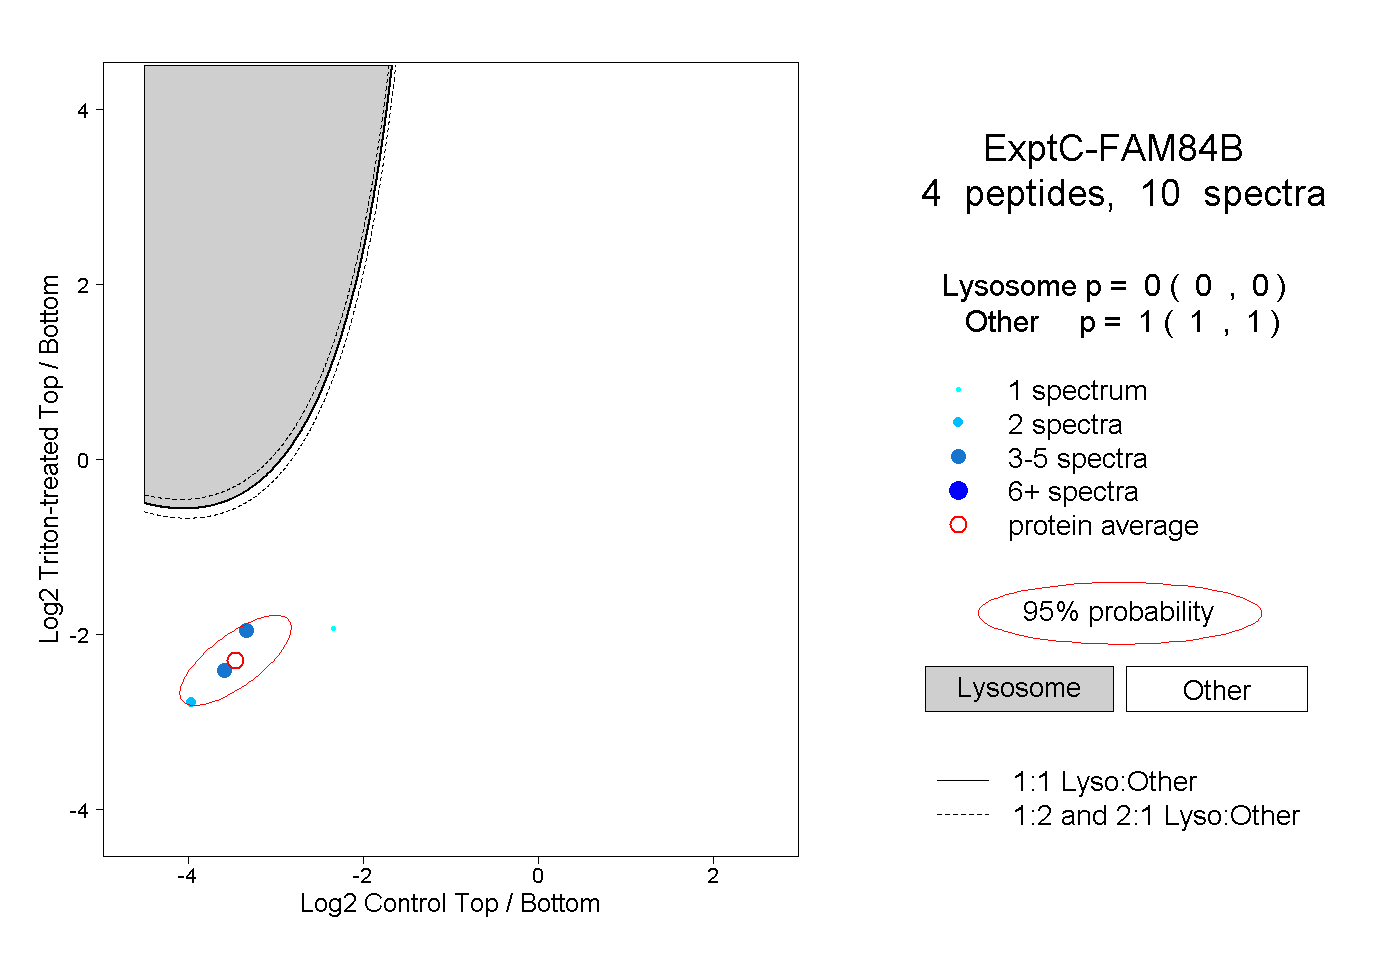
0.000 | 0.000
1.000 | 1.000