 4
4peptides
spectra
0.000 | 0.034
0.000 | 0.000
0.000 | 0.157
0.036 | 0.343
0.000 | 0.249
0.417 | 0.690
0.000 | 0.058
0.000 | 0.022
2peptides
spectra
0.000 | 0.000
1.000 | 1.000
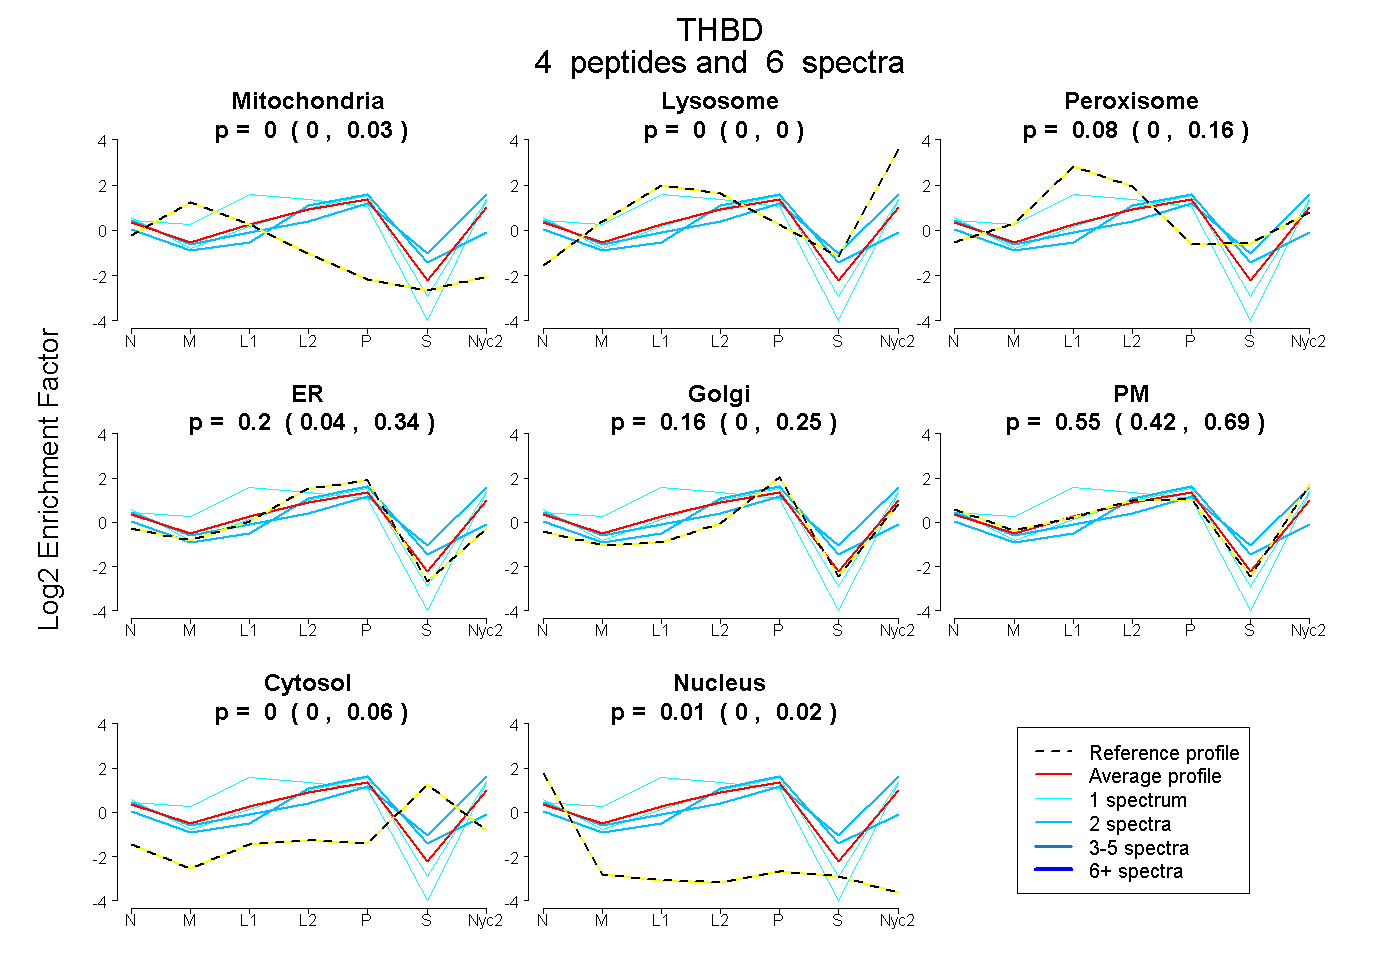
| Plot | Mito | Lyso | Perox | ER | Golgi | PM | Cytosol | Nucleus | |||||
| Expt A |
4 peptides |
6 spectra |
|
0.000 0.000 | 0.034 |
0.000 0.000 | 0.000 |
0.078 0.000 | 0.157 |
0.204 0.036 | 0.343 |
0.156 0.000 | 0.249 |
0.555 0.417 | 0.690 |
0.000 0.000 | 0.058 |
0.007 0.000 | 0.022 |
||
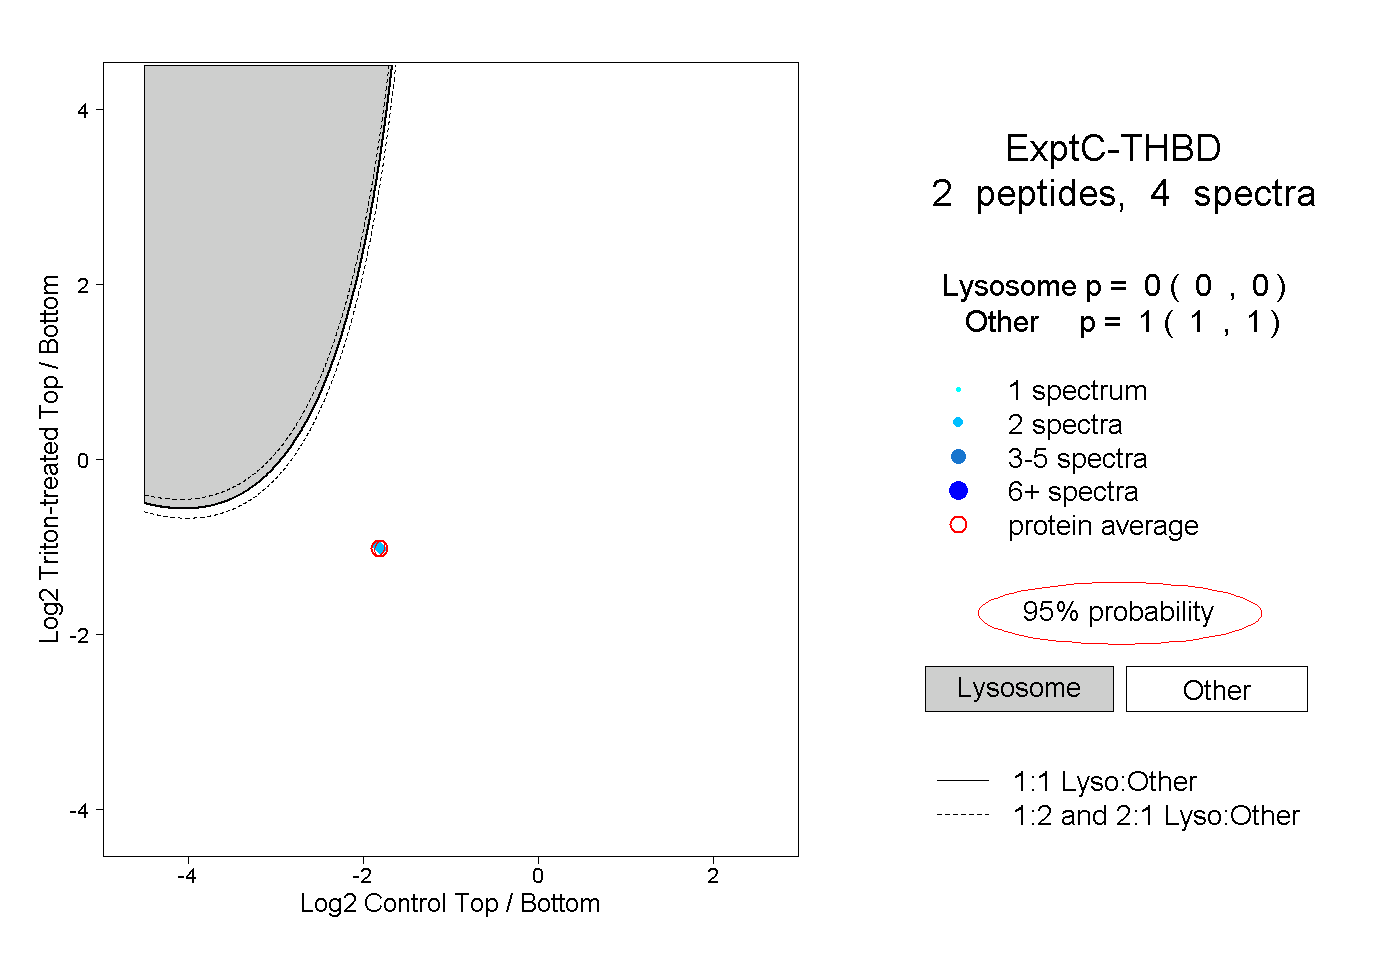
| Plot | Lyso | Other | |||||||||||
| Expt C |
2 peptides |
4 spectra |
|
0.000 0.000 | 0.000 |
1.000 1.000 | 1.000 |