 4
4peptides
spectra
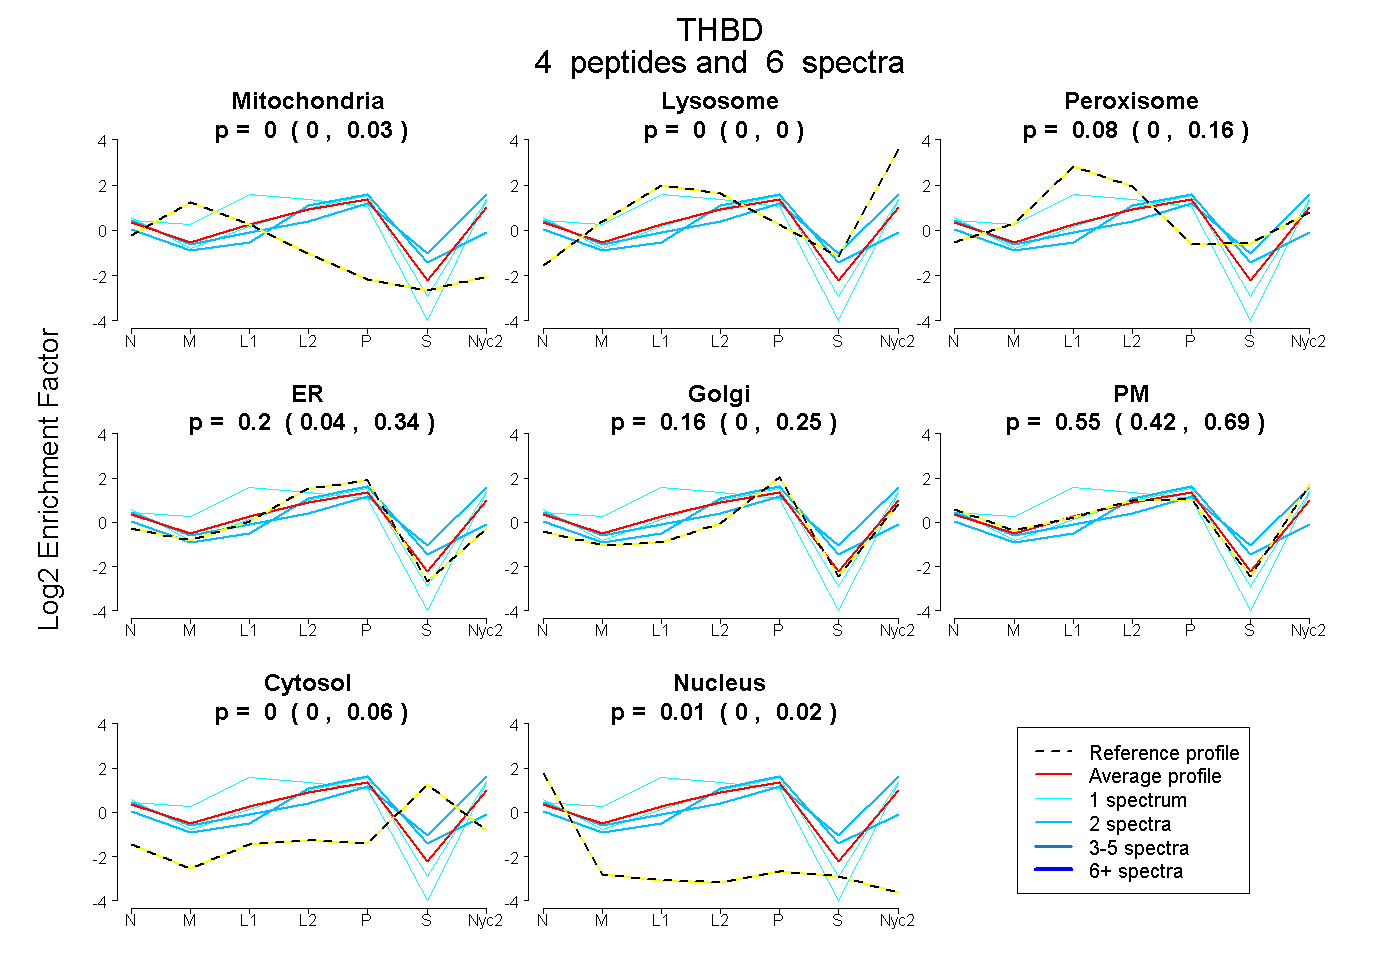
0.000 | 0.034
0.000 | 0.000
0.000 | 0.157
0.036 | 0.343
0.000 | 0.249
0.417 | 0.690
0.000 | 0.058
0.000 | 0.022
| Plot | Mito | Lyso | Perox | ER | Golgi | PM | Cytosol | Nucleus | |||||
| Expt A |
4 peptides |
6 spectra |
|
0.000 0.000 | 0.034 |
0.000 0.000 | 0.000 |
0.078 0.000 | 0.157 |
0.204 0.036 | 0.343 |
0.156 0.000 | 0.249 |
0.555 0.417 | 0.690 |
0.000 0.000 | 0.058 |
0.007 0.000 | 0.022 |
| 1 spectrum, CVCPSGGDLQADGR | 0.037 | 0.037 | 0.074 | 0.148 | 0.000 | 0.704 | 0.000 | 0.000 | ||
| 1 spectrum, CEDVDDCK | 0.000 | 0.000 | 0.000 | 0.168 | 0.101 | 0.731 | 0.000 | 0.000 | ||
| 2 spectra, LQGHLMTVR | 0.000 | 0.000 | 0.000 | 0.643 | 0.059 | 0.128 | 0.171 | 0.000 | ||
| 2 spectra, EVVLQHVR | 0.000 | 0.073 | 0.000 | 0.000 | 0.084 | 0.674 | 0.169 | 0.000 |
| Plot | Lyso | Other | |||||||||||
| Expt C |
2 peptides |
4 spectra |
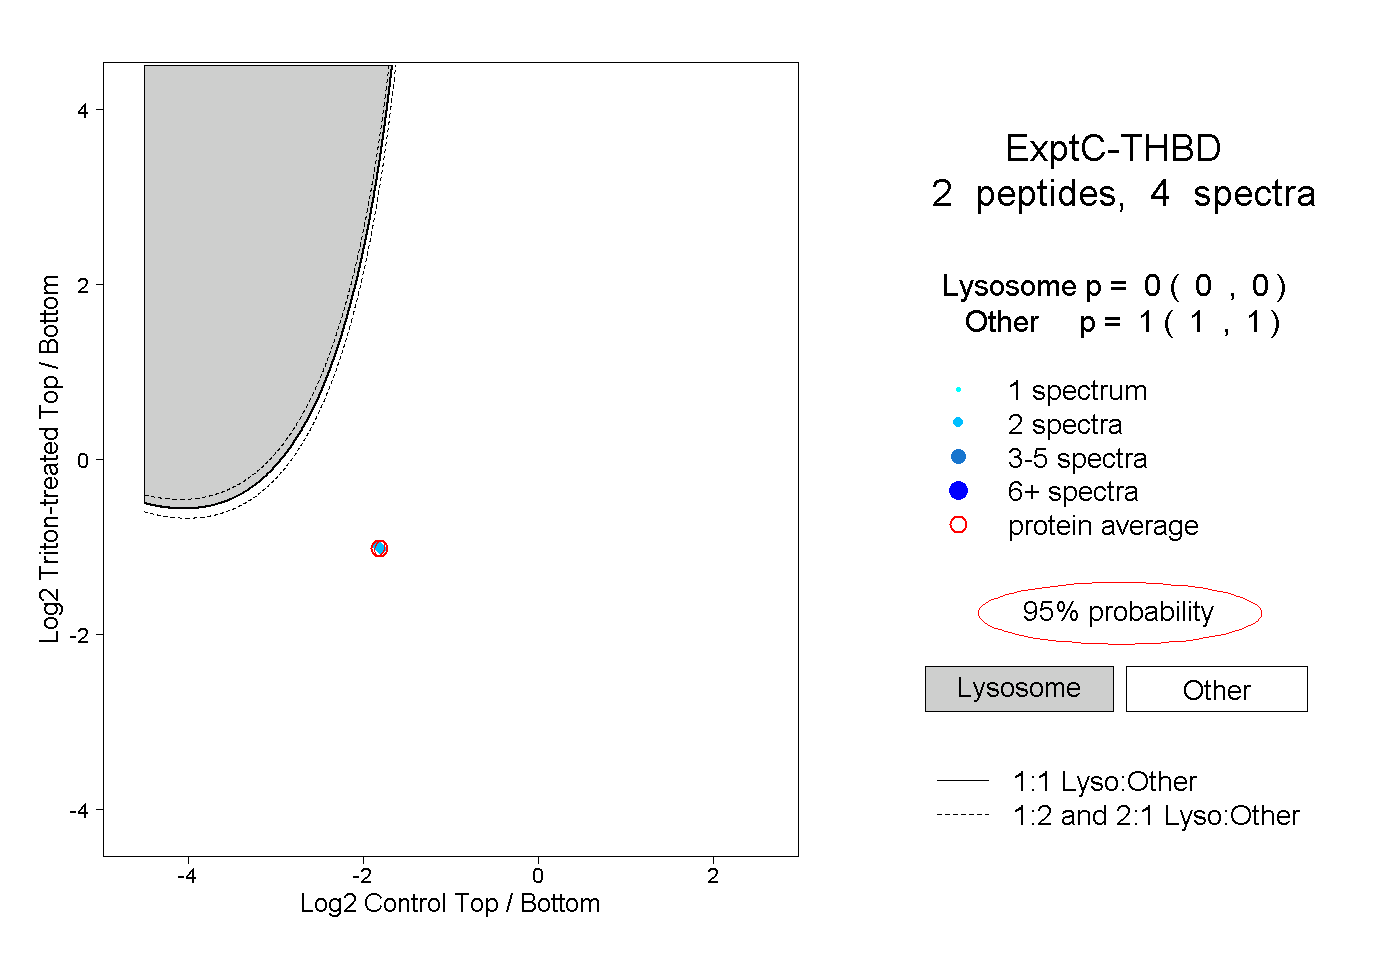 |
0.000 0.000 | 0.000 |
1.000 1.000 | 1.000 |