 2
2peptides
spectra
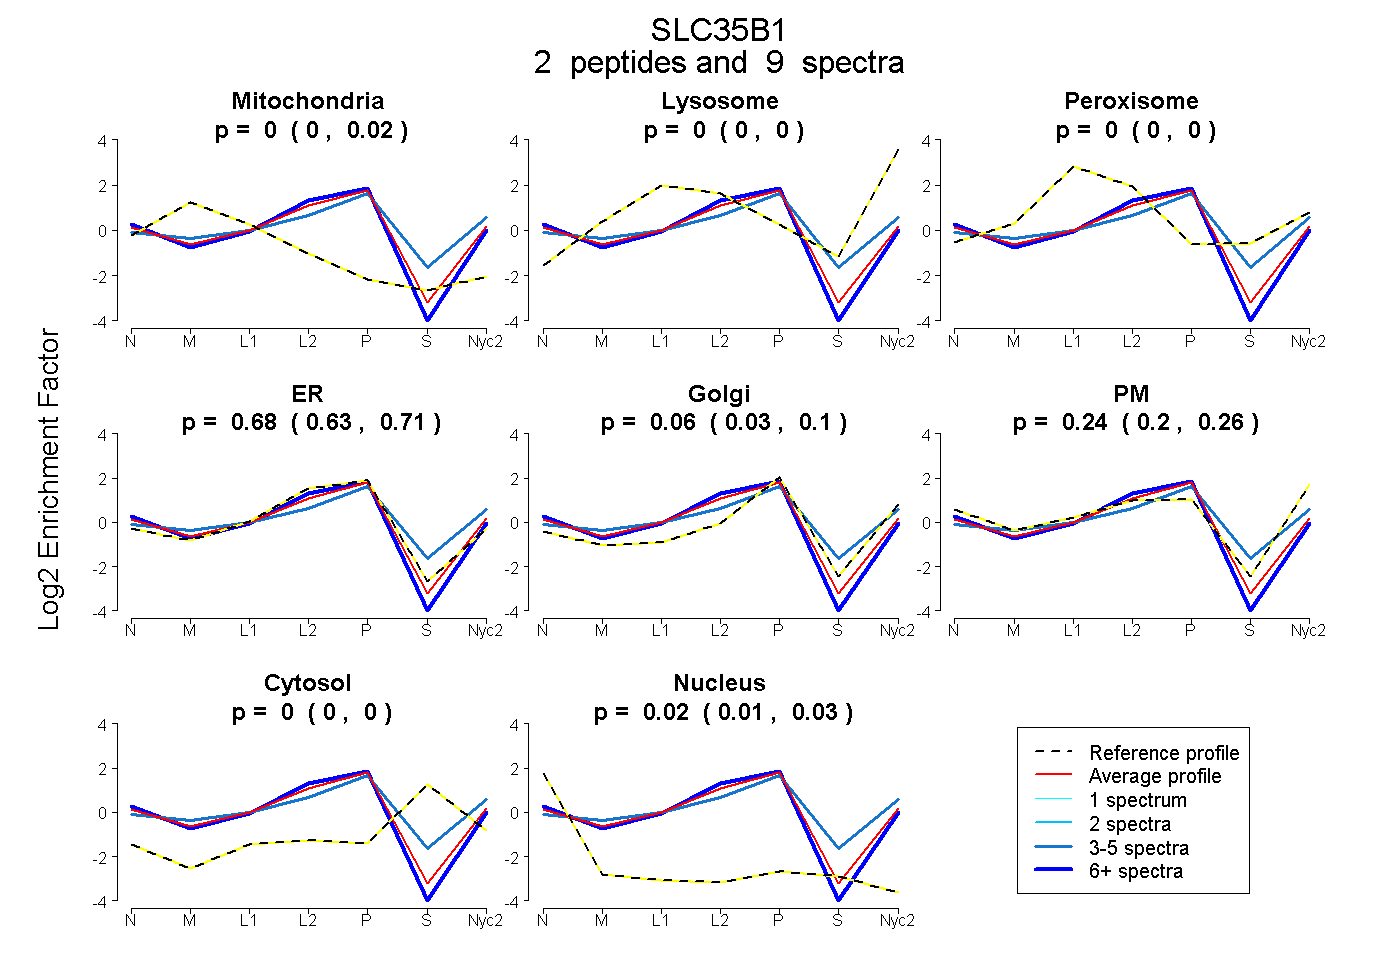
0.000 | 0.017
0.000 | 0.000
0.000 | 0.000
0.634 | 0.714
0.025 | 0.103
0.201 | 0.258
0.000 | 0.000
0.008 | 0.028
1peptide
spectrum
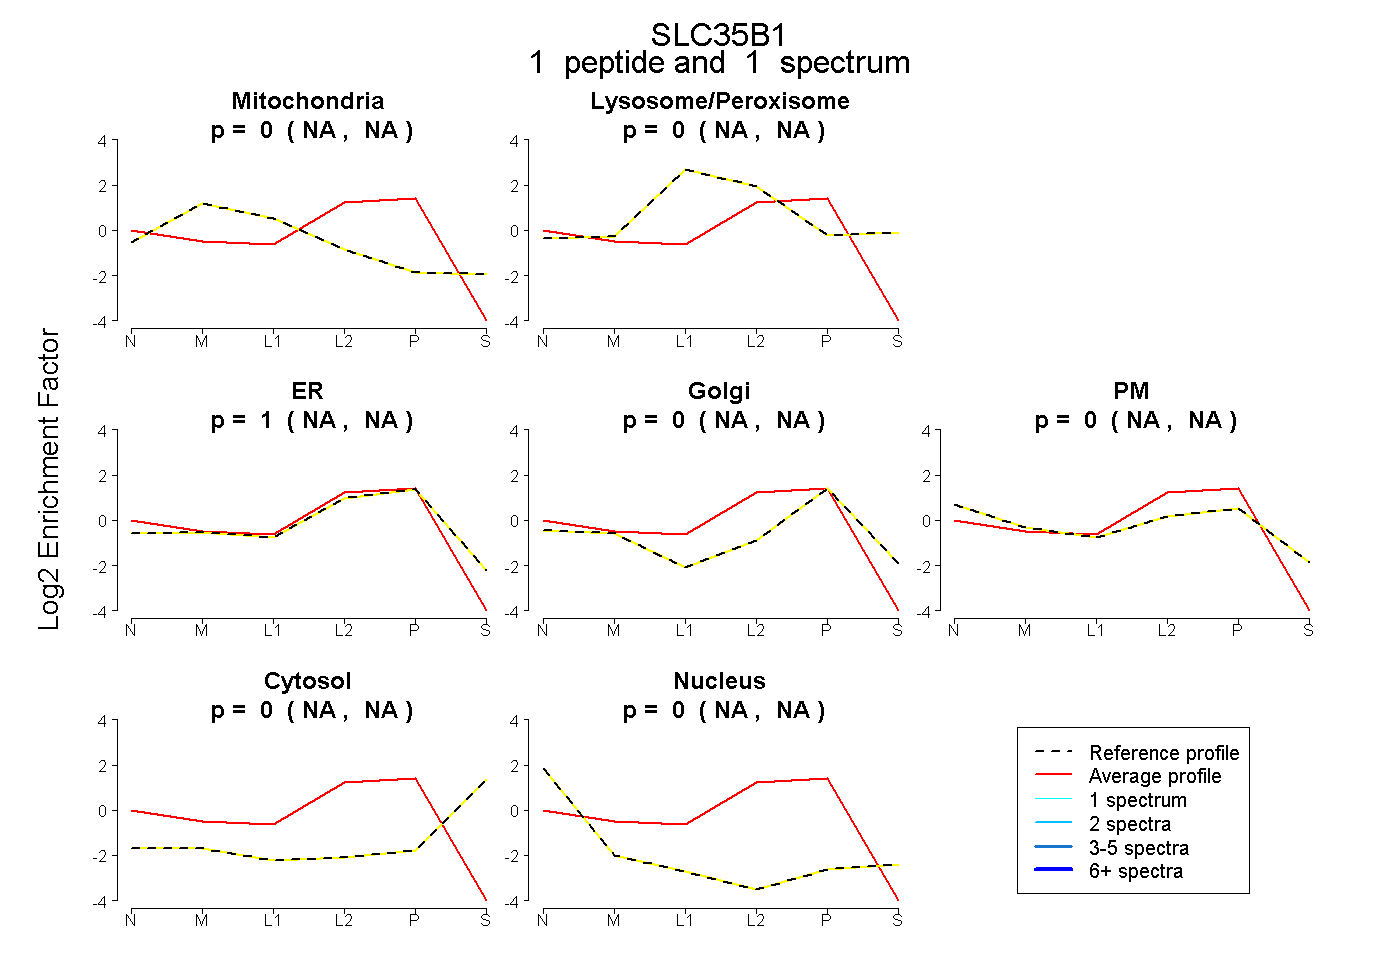
NA | NA
NA | NA
NA | NA
NA | NA
NA | NA
NA | NA
NA | NA
2peptides
spectra
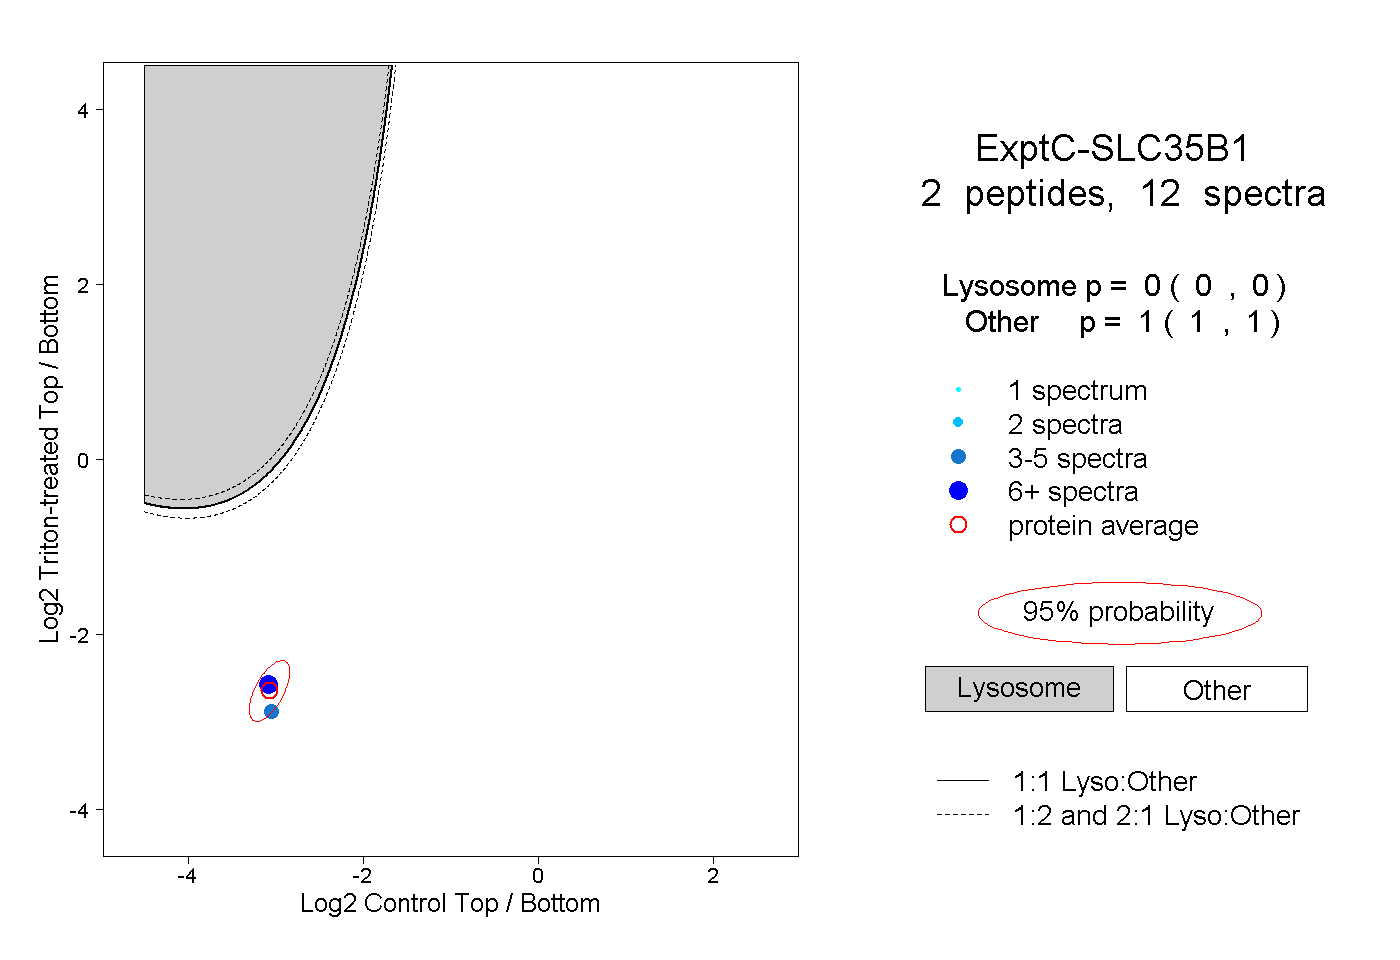
0.000 | 0.000
1.000 | 1.000