 2
2peptides
spectra
0.000 | 0.017
0.000 | 0.000
0.000 | 0.000
0.634 | 0.714
0.025 | 0.103
0.201 | 0.258
0.000 | 0.000
0.008 | 0.028
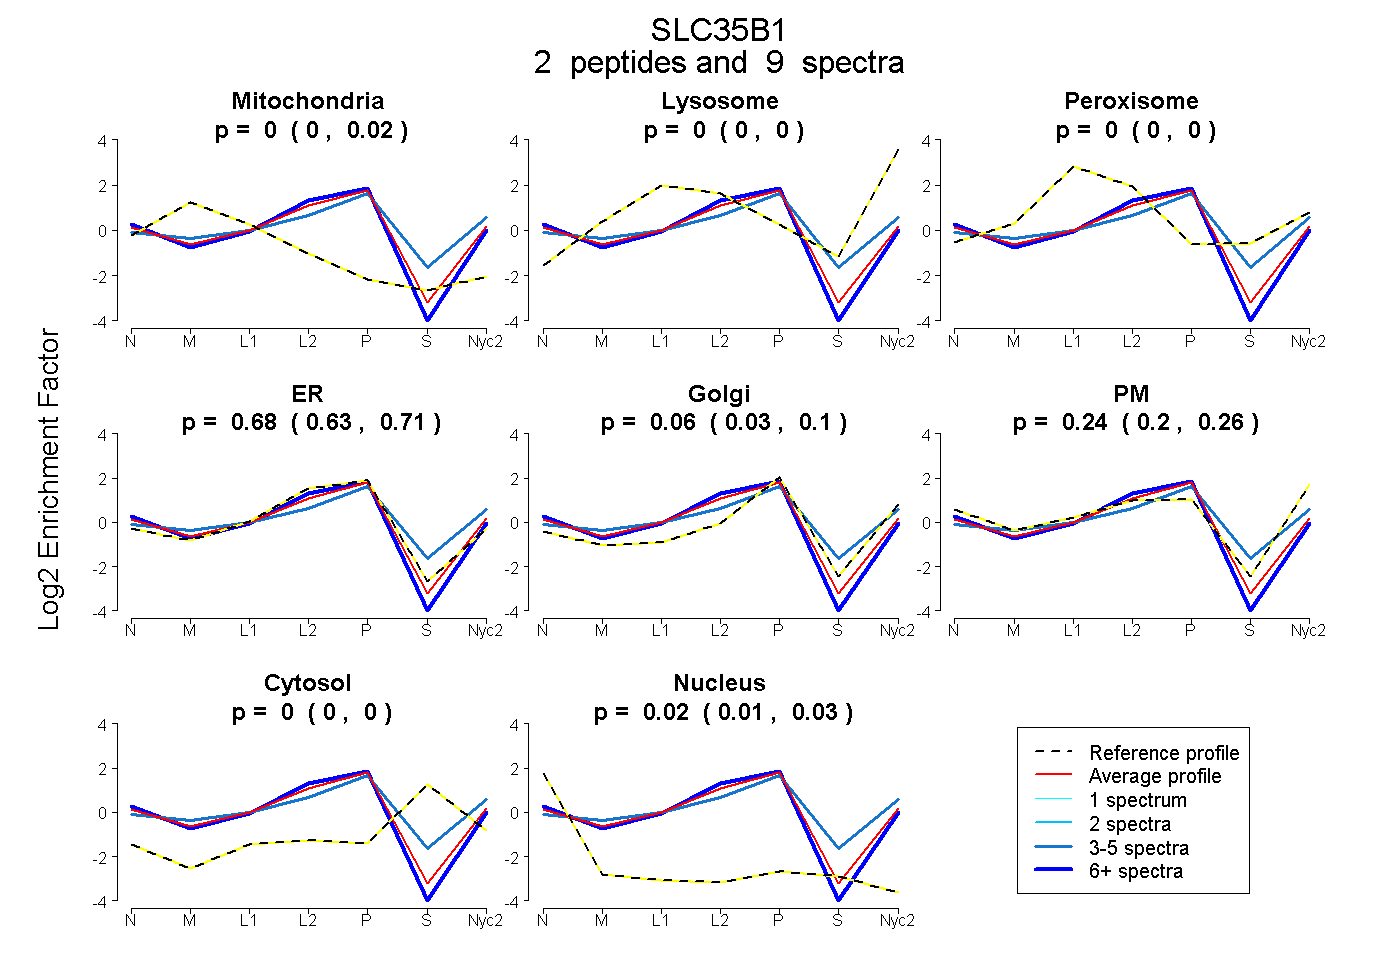
| Plot | Mito | Lyso | Perox | ER | Golgi | PM | Cytosol | Nucleus | |||||
| Expt A |
2 peptides |
9 spectra |
|
0.000 0.000 | 0.017 |
0.000 0.000 | 0.000 |
0.000 0.000 | 0.000 |
0.679 0.634 | 0.714 |
0.062 0.025 | 0.103 |
0.237 0.201 | 0.258 |
0.000 0.000 | 0.000 |
0.022 0.008 | 0.028 |
| 3 spectra, YGEGPK | 0.000 | 0.000 | 0.231 | 0.129 | 0.607 | 0.031 | 0.003 | 0.000 | ||
| 6 spectra, ILIQFFDTAR | 0.000 | 0.000 | 0.000 | 0.825 | 0.000 | 0.146 | 0.000 | 0.029 |
| Plot | Mito | Lyso or Perox | ER | Golgi | PM | Cytosol | Nucleus | ||||||
| Expt B |
1 peptide |
1 spectrum |
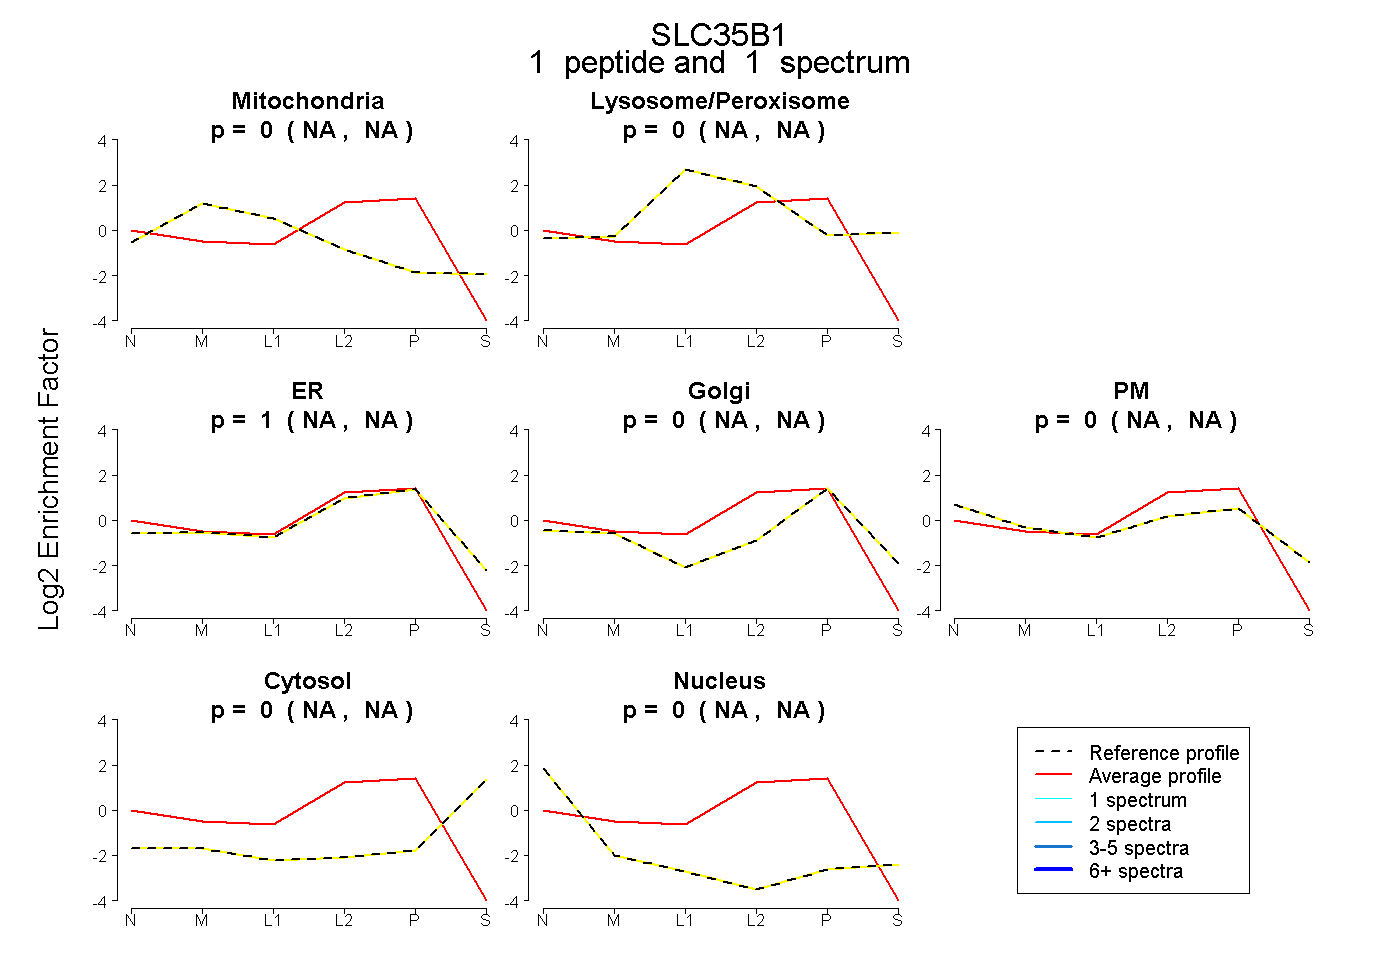 |
0.000 NA | NA |
0.000 NA | NA |
0.995 NA | NA |
0.000 NA | NA |
0.000 NA | NA |
0.000 NA | NA |
0.005 NA | NA |
|||
| Plot | Lyso | Other | |||||||||||
| Expt C |
2 peptides |
12 spectra |
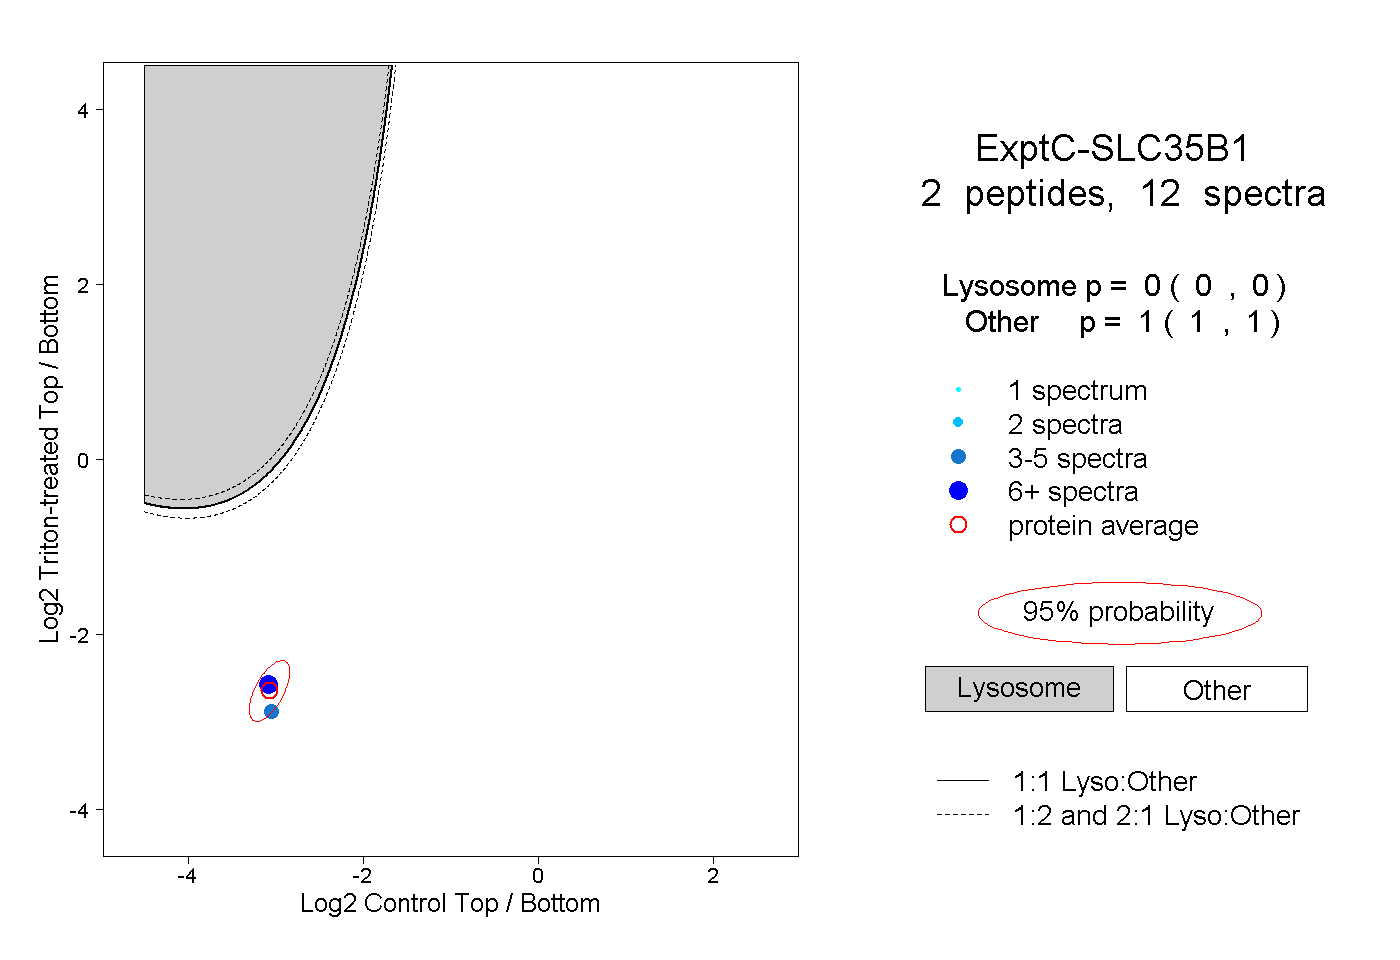 |
0.000 0.000 | 0.000 |
1.000 1.000 | 1.000 |