 7
7peptides
spectra
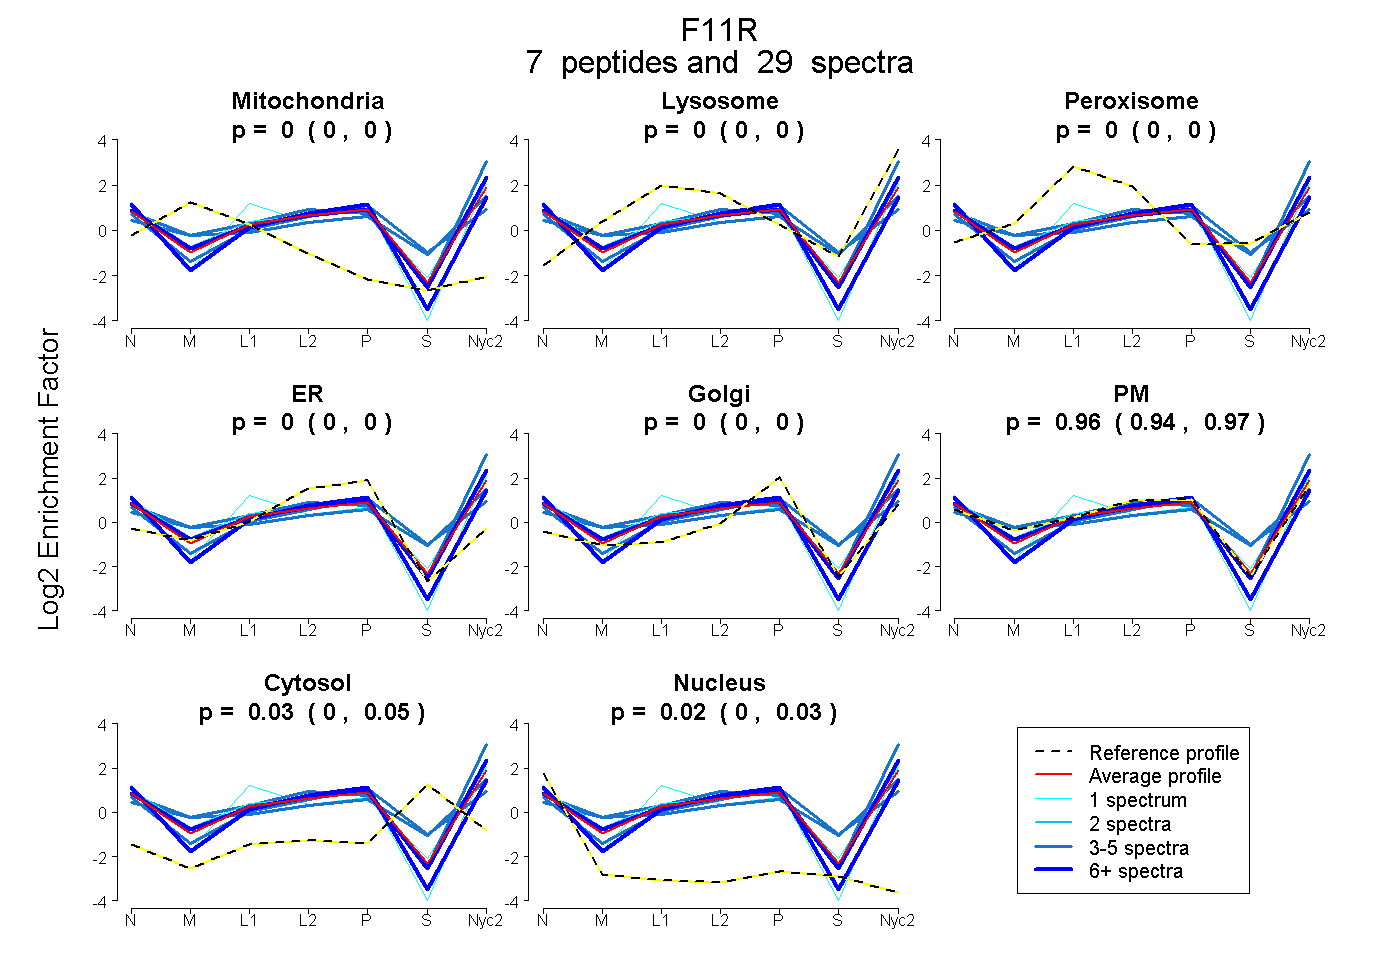
0.000 | 0.000
0.000 | 0.000
0.000 | 0.000
0.000 | 0.000
0.000 | 0.000
0.940 | 0.968
0.003 | 0.051
0.000 | 0.028
2peptides
spectra
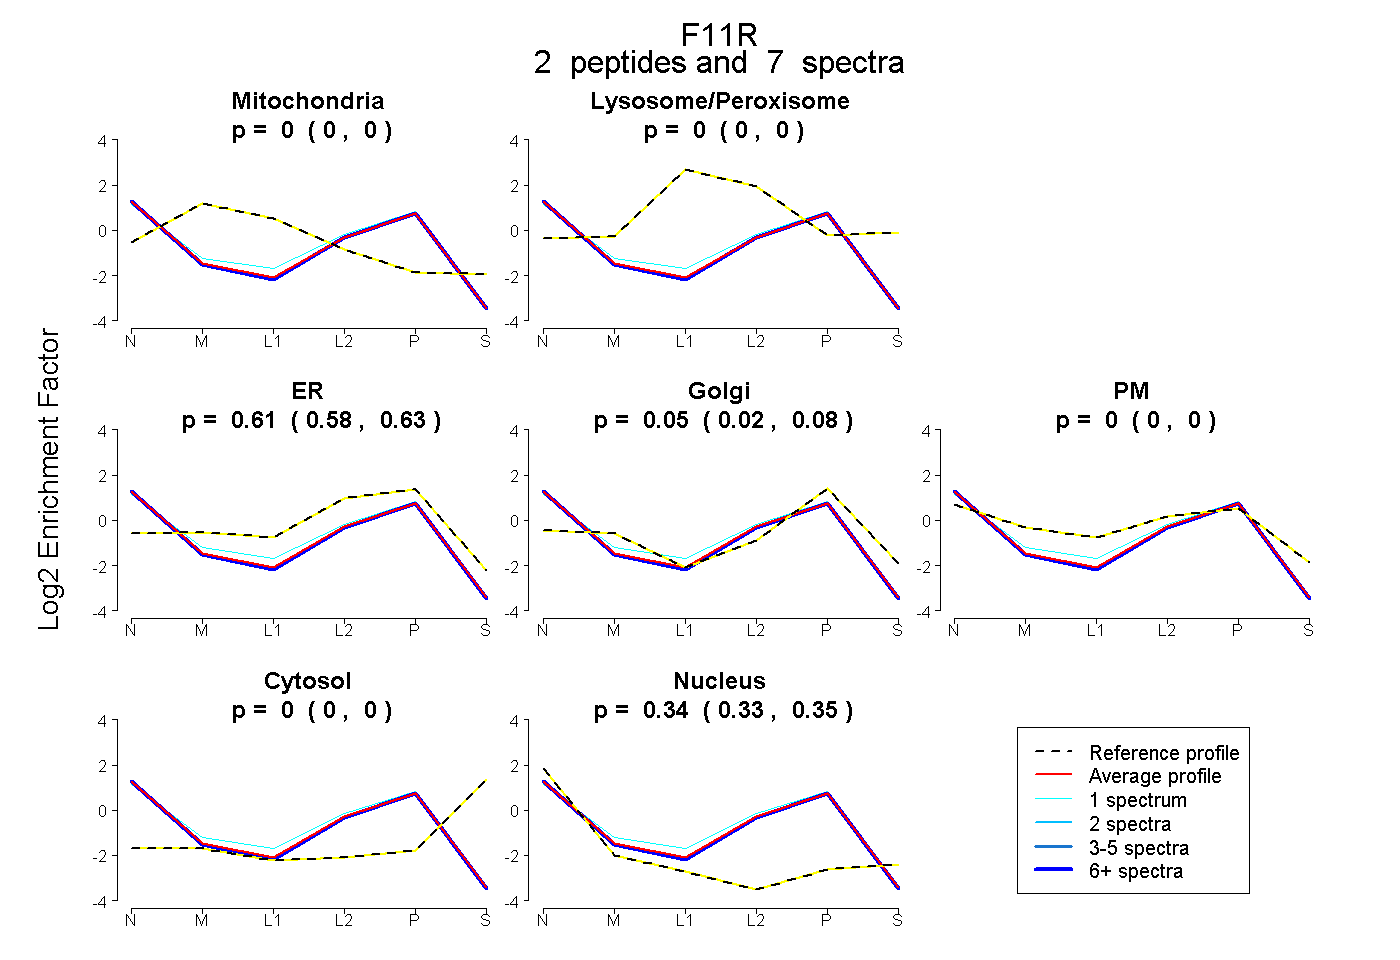
0.000 | 0.000
0.000 | 0.000
0.582 | 0.626
0.024 | 0.077
0.000 | 0.000
0.000 | 0.000
0.332 | 0.346
6peptides
spectra
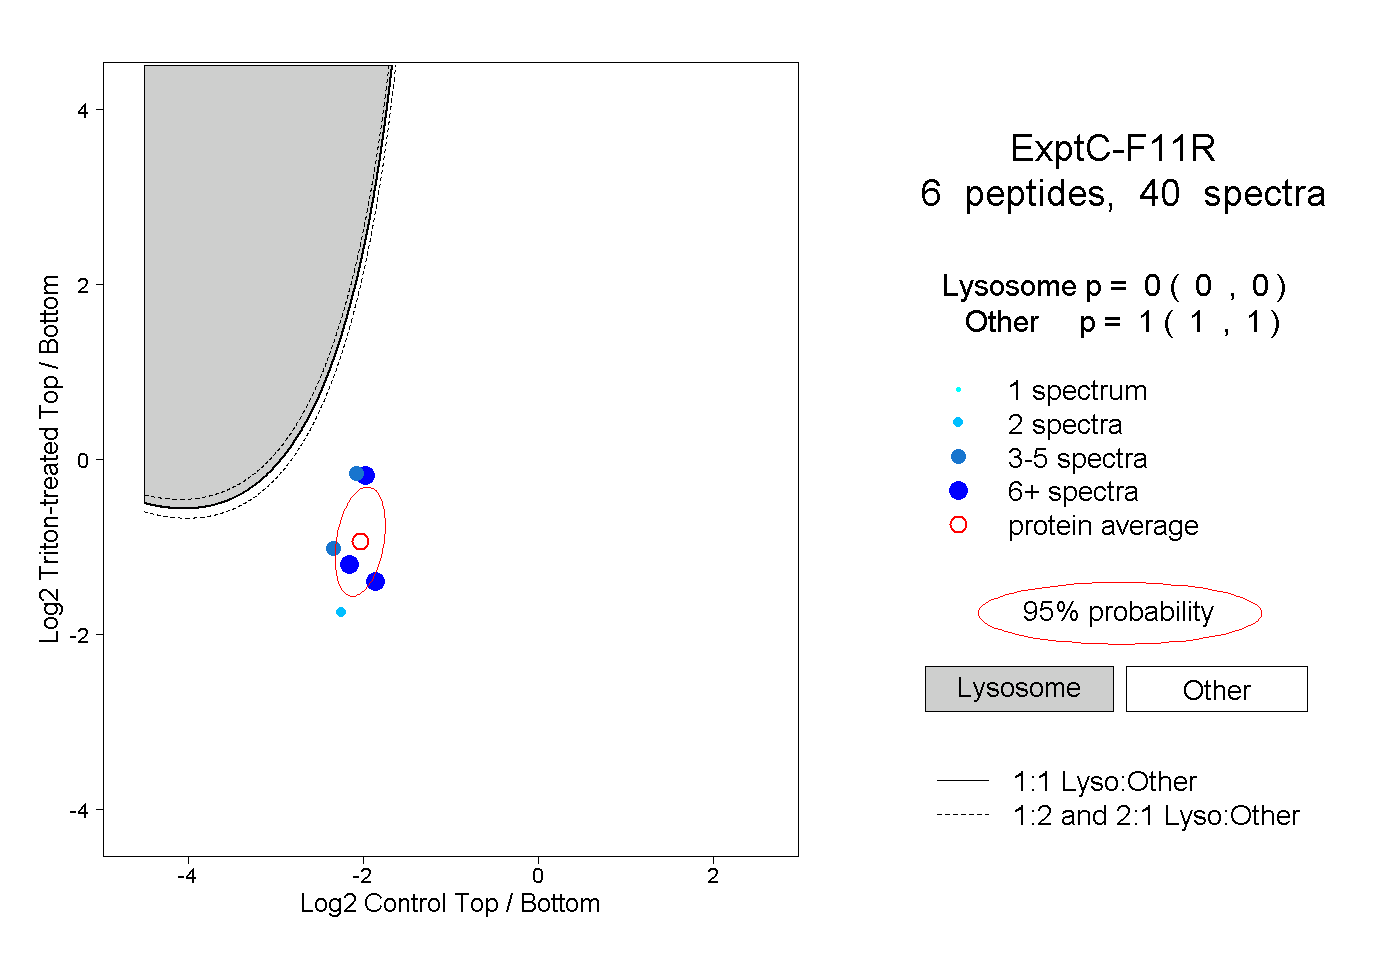
0.000 | 0.000
1.000 | 1.000
2peptides
spectra
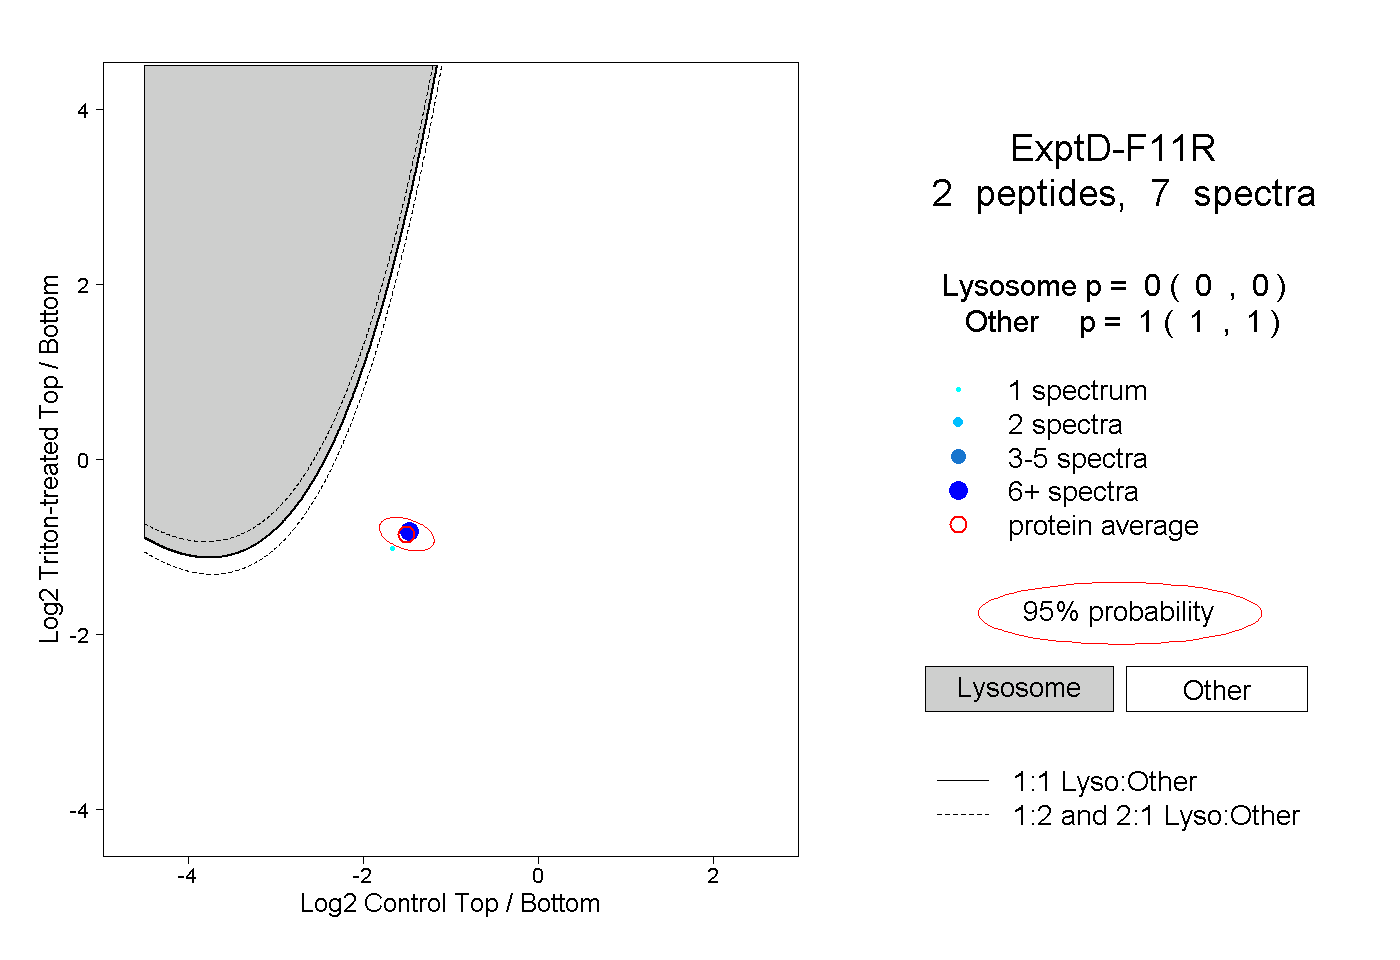
0.000 | 0.000
1.000 | 1.000