 7
7peptides
spectra
0.000 | 0.000
0.000 | 0.000
0.000 | 0.000
0.000 | 0.000
0.000 | 0.000
0.940 | 0.968
0.003 | 0.051
0.000 | 0.028
| Plot | Mito | Lyso | Perox | ER | Golgi | PM | Cytosol | Nucleus | |||||
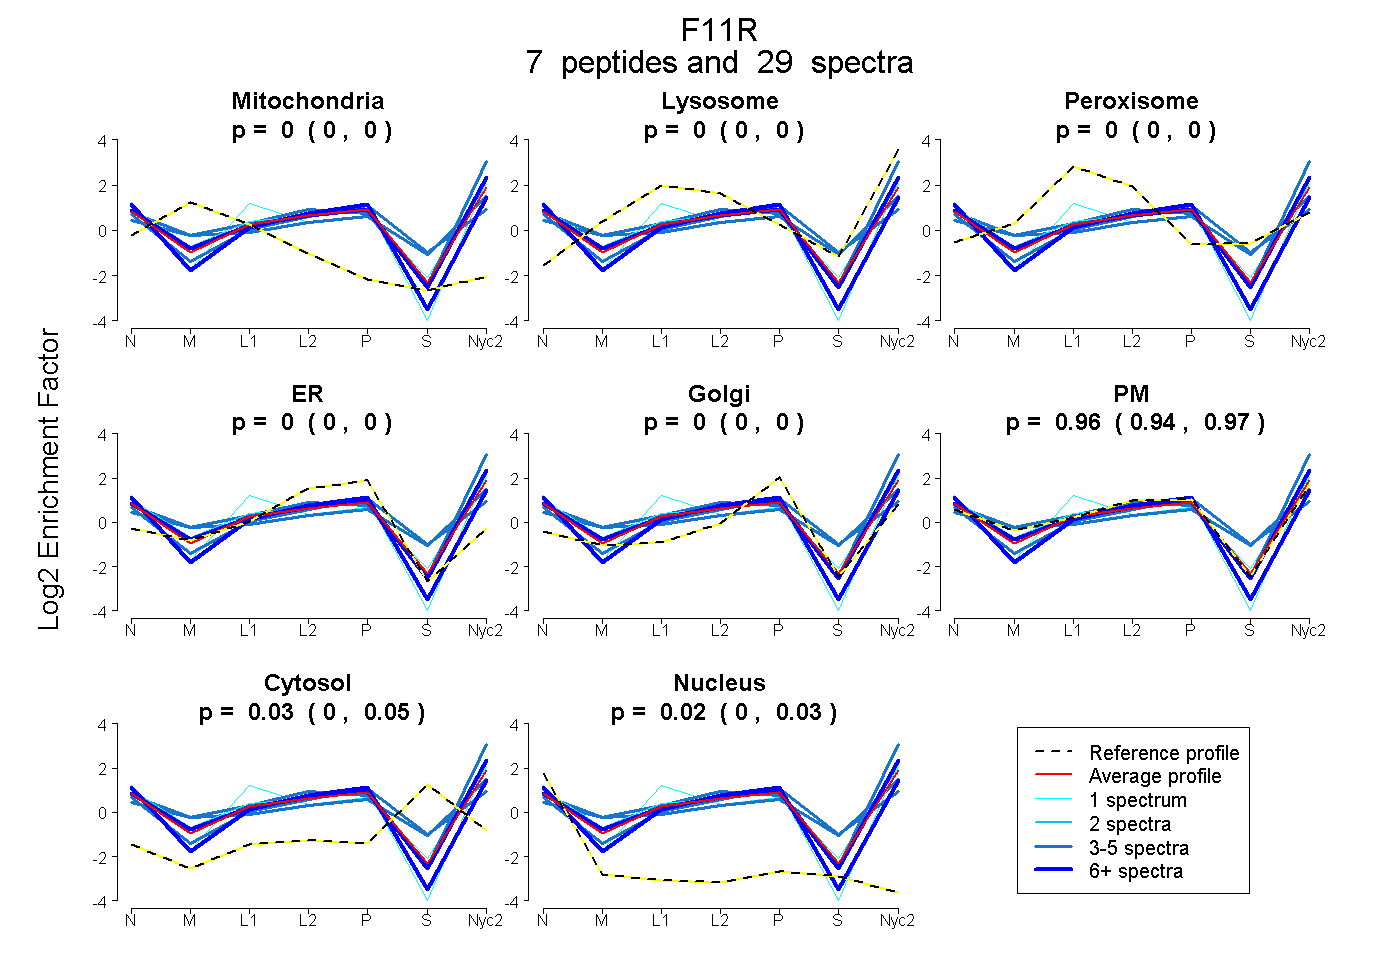
| Expt A |
7 peptides |
29 spectra |
|
0.000 0.000 | 0.000 |
0.000 0.000 | 0.000 |
0.000 0.000 | 0.000 |
0.000 0.000 | 0.000 |
0.000 0.000 | 0.000 |
0.955 0.940 | 0.968 |
0.029 0.003 | 0.051 |
0.015 0.000 | 0.028 |
| 5 spectra, SEGEFK | 0.000 | 0.000 | 0.000 | 0.085 | 0.000 | 0.680 | 0.236 | 0.000 | ||
| 1 spectrum, LPCIYSGFSSPR | 0.000 | 0.000 | 0.000 | 0.000 | 0.000 | 1.000 | 0.000 | 0.000 | ||
| 3 spectra, DGVPMLTADAK | 0.000 | 0.182 | 0.000 | 0.000 | 0.000 | 0.818 | 0.000 | 0.000 | ||
| 4 spectra, GTAPGK | 0.000 | 0.077 | 0.001 | 0.000 | 0.000 | 0.717 | 0.205 | 0.000 | ||
| 7 spectra, VTFSSSGITFSSVTR | 0.000 | 0.004 | 0.000 | 0.000 | 0.000 | 0.996 | 0.000 | 0.000 | ||
| 1 spectrum, AVLTCSEHDGSPPSEYSWFK | 0.000 | 0.028 | 0.077 | 0.000 | 0.000 | 0.837 | 0.018 | 0.040 | ||
| 8 spectra, VIYSQPSAR | 0.000 | 0.000 | 0.000 | 0.057 | 0.002 | 0.857 | 0.000 | 0.084 |
| Plot | Mito | Lyso or Perox | ER | Golgi | PM | Cytosol | Nucleus | ||||||
| Expt B |
2 peptides |
7 spectra |
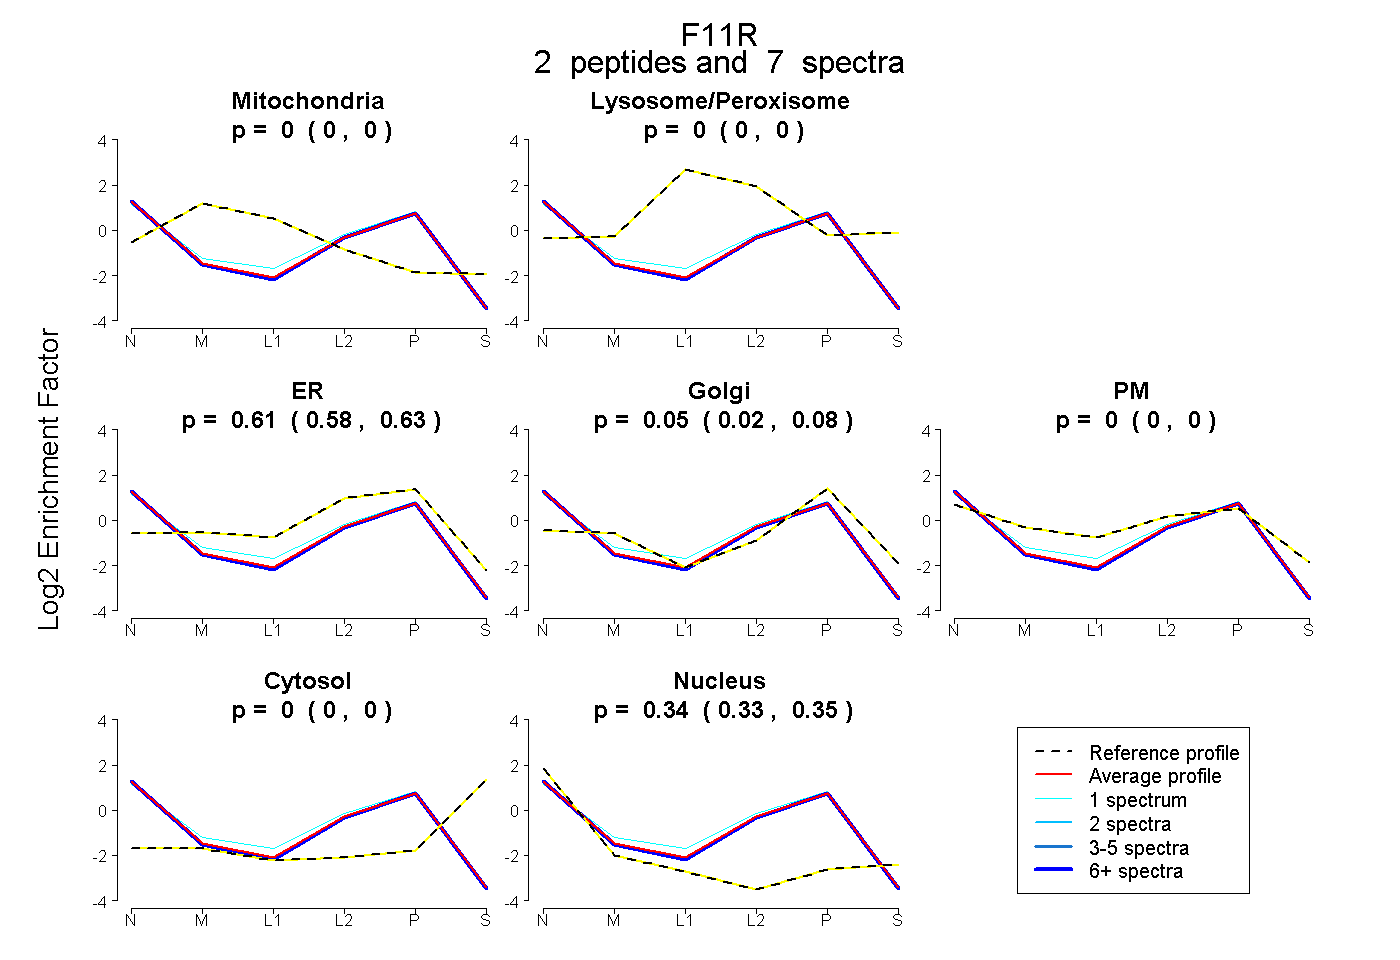 |
0.000 0.000 | 0.000 |
0.000 0.000 | 0.000 |
0.607 0.582 | 0.626 |
0.053 0.024 | 0.077 |
0.000 0.000 | 0.000 |
0.000 0.000 | 0.000 |
0.340 0.332 | 0.346 |
|||
| Plot | Lyso | Other | |||||||||||
| Expt C |
6 peptides |
40 spectra |
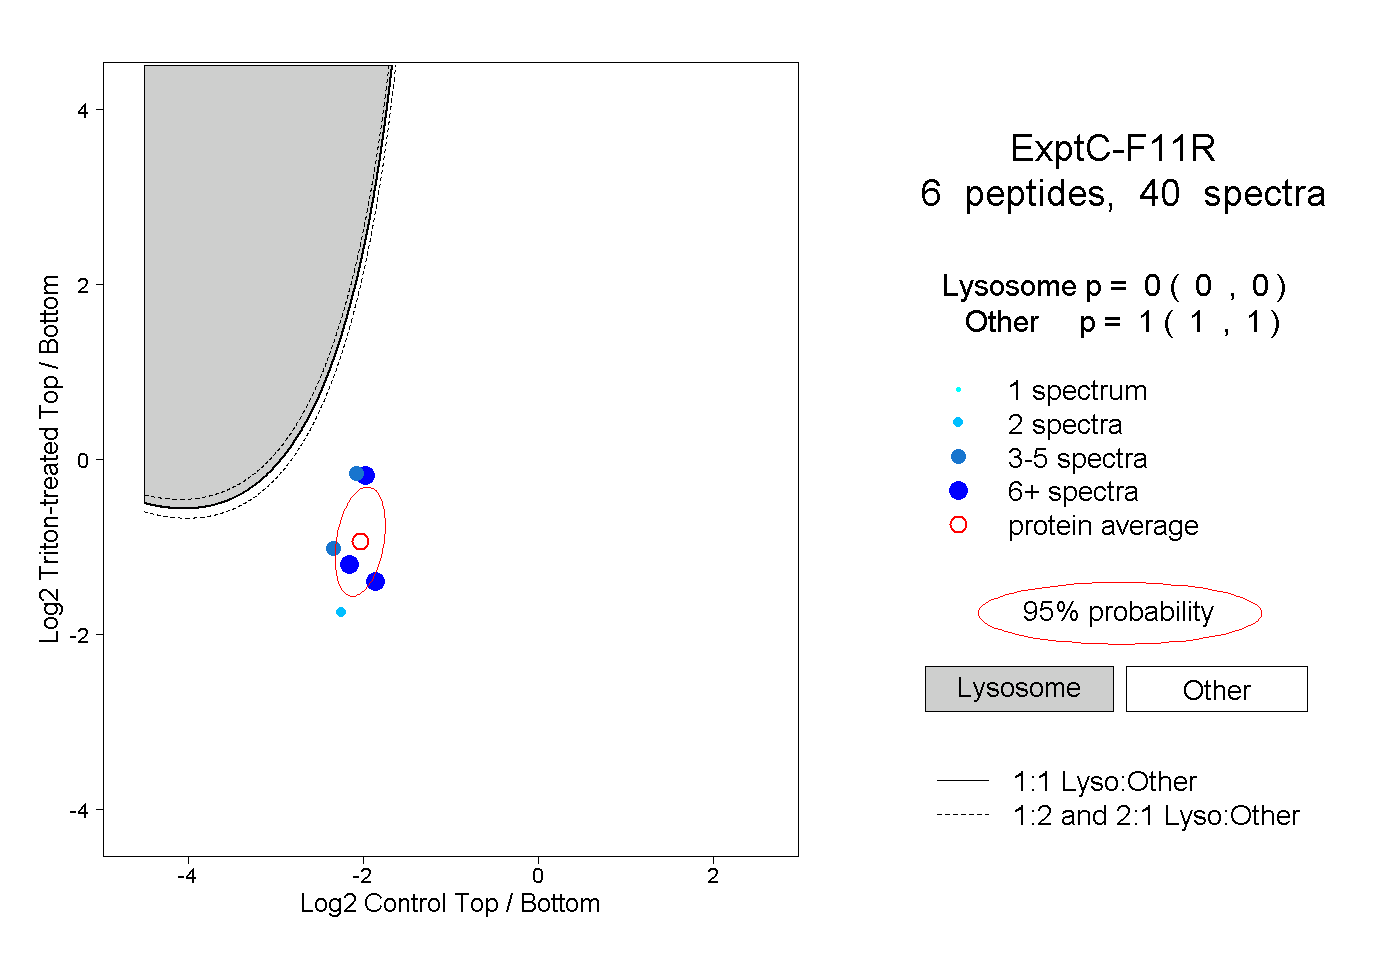 |
0.000 0.000 | 0.000 |
1.000 1.000 | 1.000 |
||||||||
| Plot | Lyso | Other | |||||||||||
| Expt D |
2 peptides |
7 spectra |
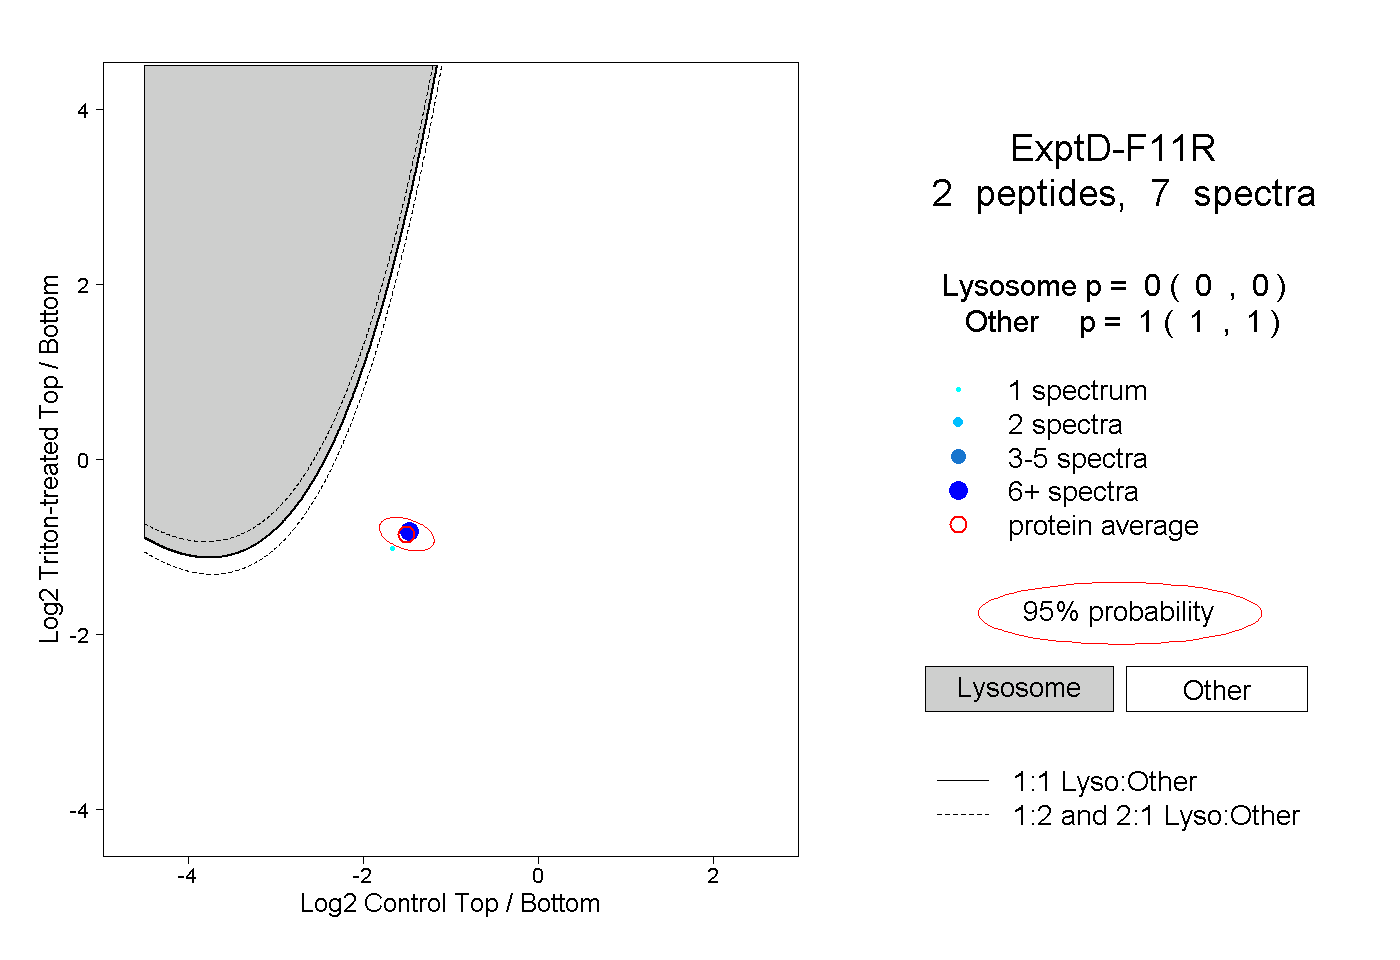 |
0.000 0.000 | 0.000 |
1.000 1.000 | 1.000 |