 7
7peptides
spectra
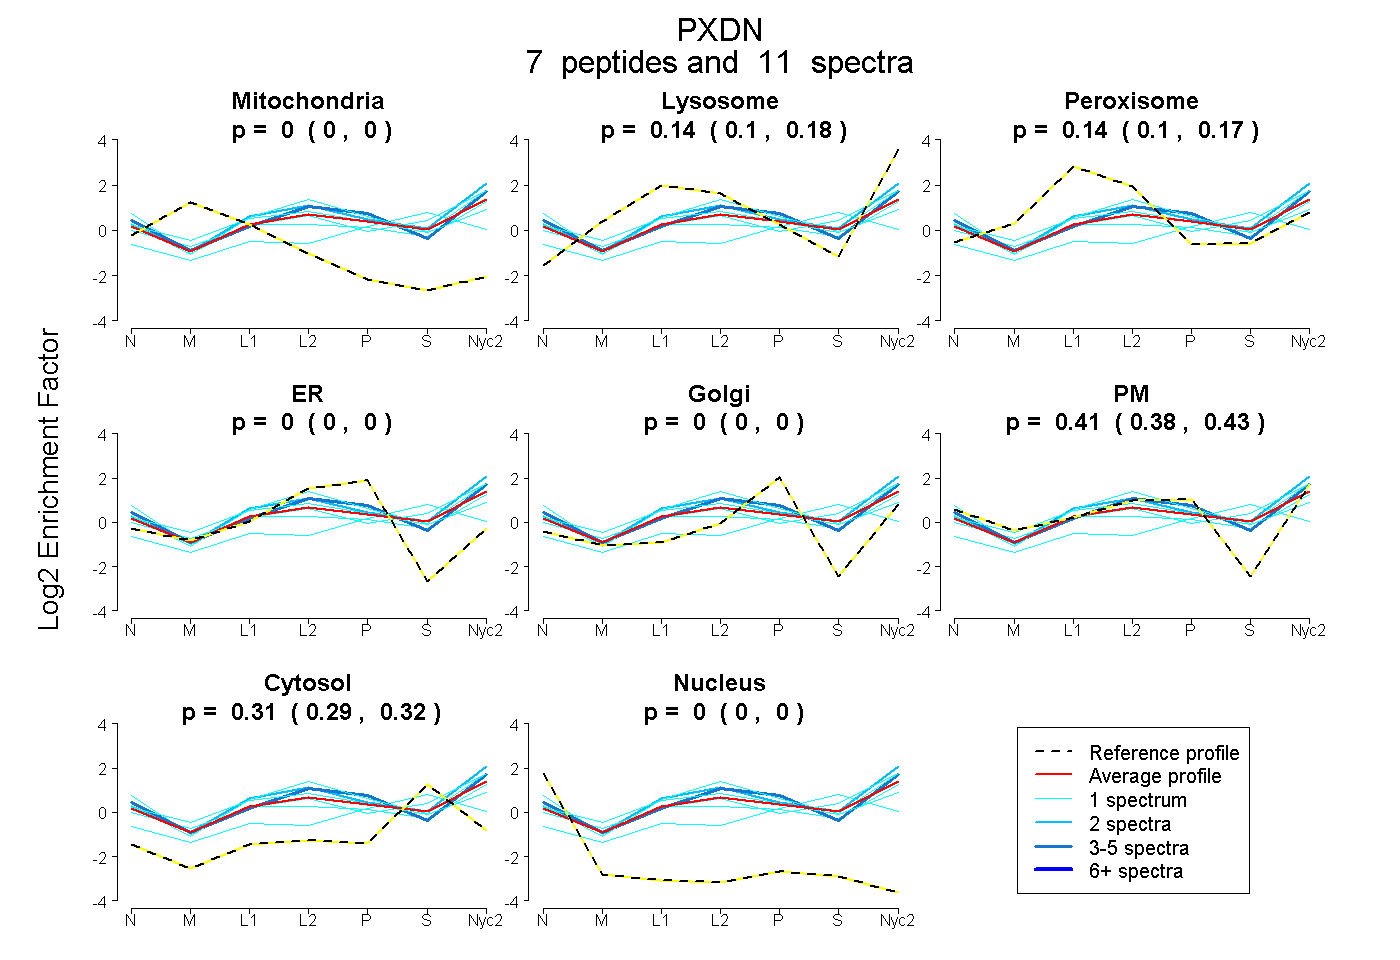
0.000 | 0.000
0.096 | 0.185
0.095 | 0.172
0.000 | 0.000
0.000 | 0.000
0.382 | 0.433
0.292 | 0.324
0.000 | 0.000
1peptide
spectrum
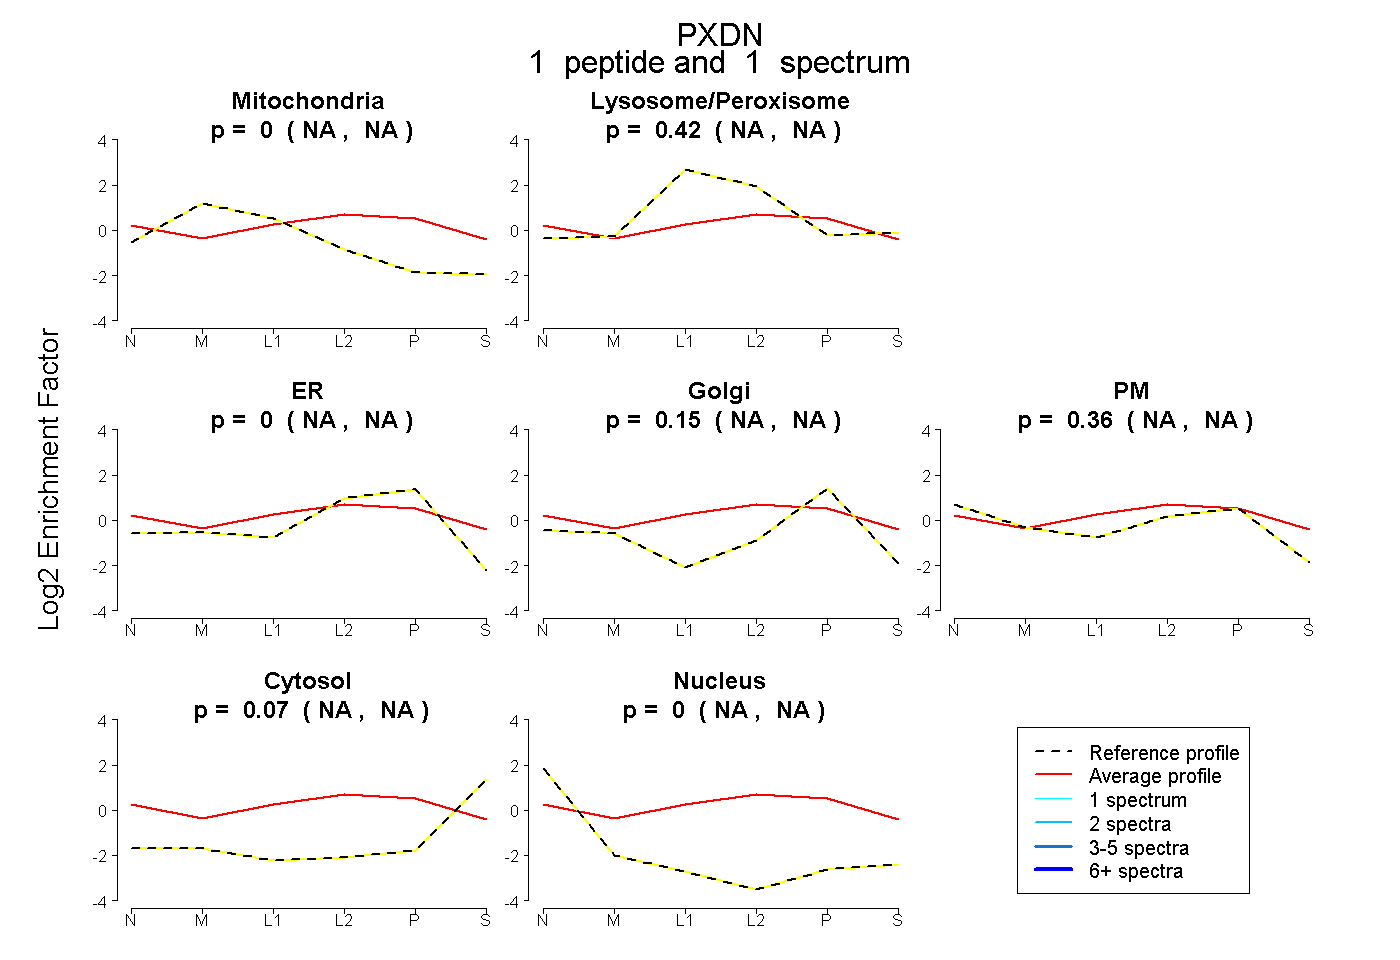
NA | NA
NA | NA
NA | NA
NA | NA
NA | NA
NA | NA
NA | NA
8peptides
spectra
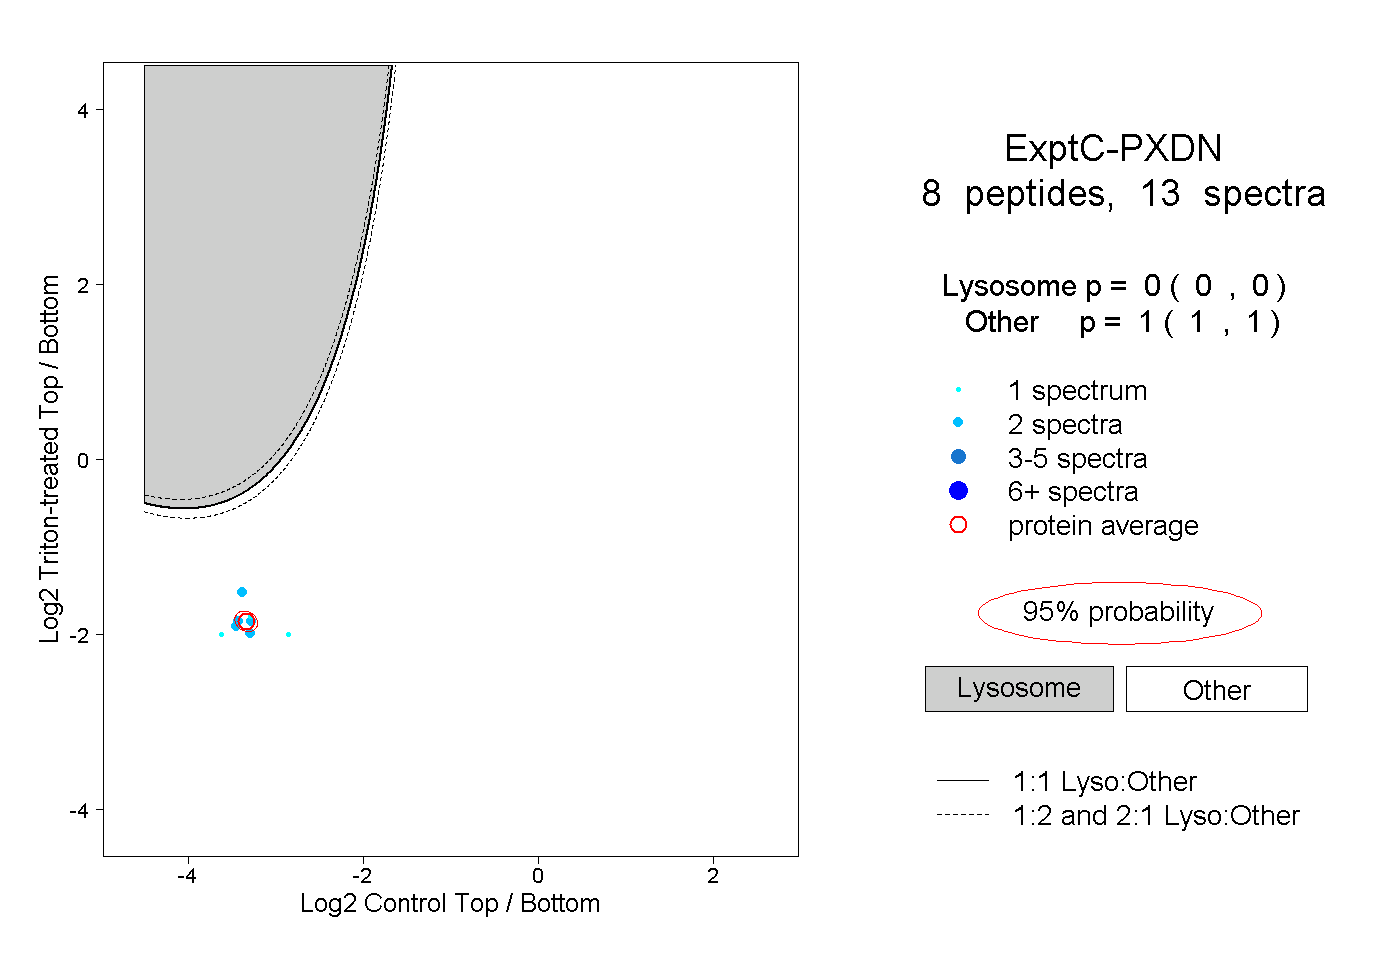
0.000 | 0.000
1.000 | 1.000
1peptide
spectra
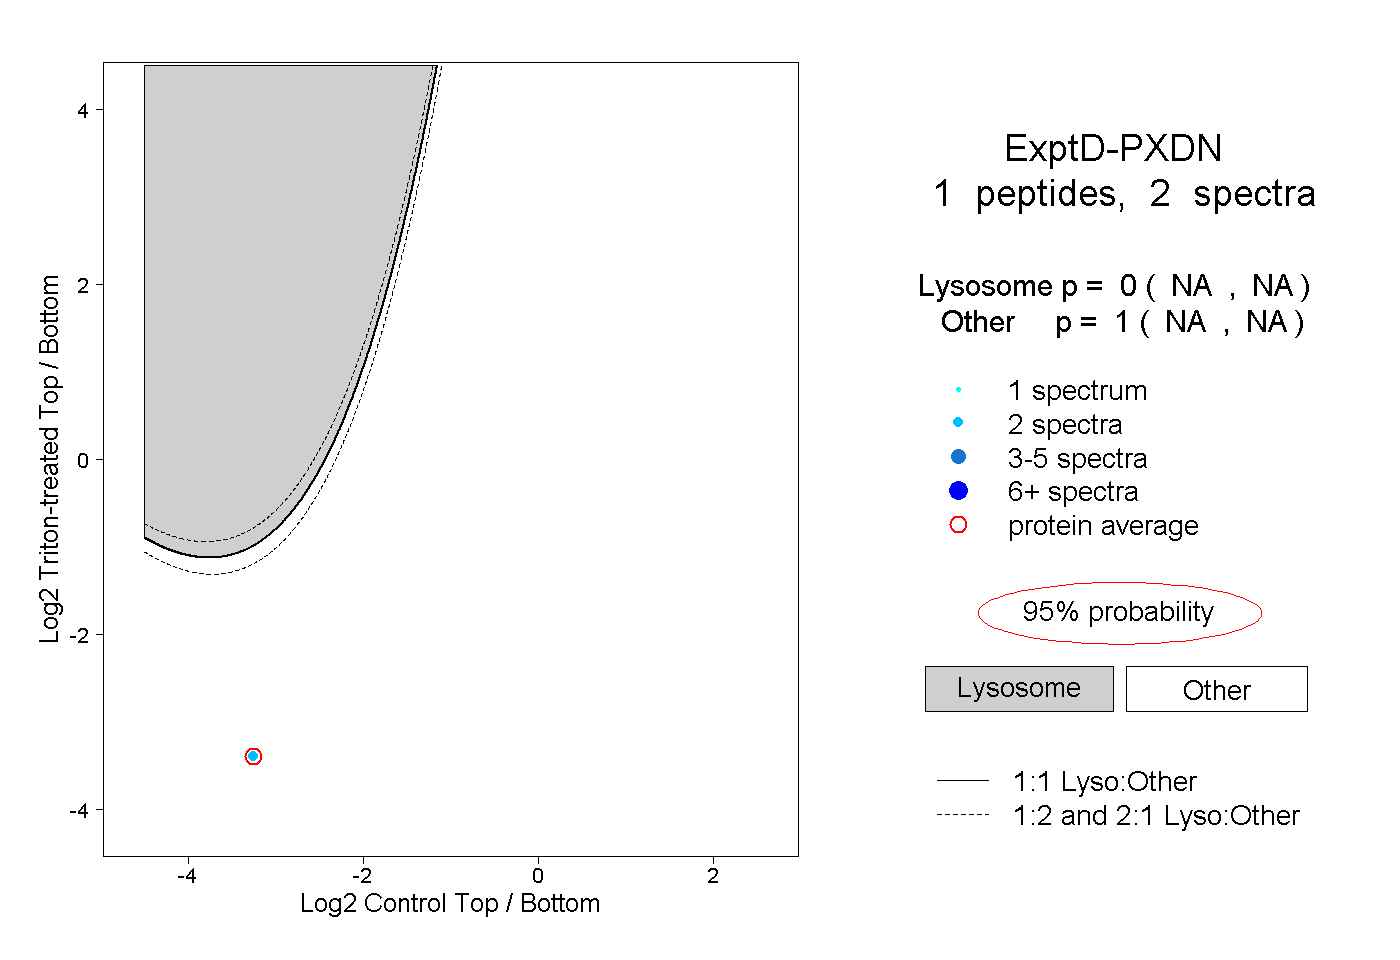
NA | NA
NA | NA