 7
7peptides
spectra
0.000 | 0.000
0.096 | 0.185
0.095 | 0.172
0.000 | 0.000
0.000 | 0.000
0.382 | 0.433
0.292 | 0.324
0.000 | 0.000
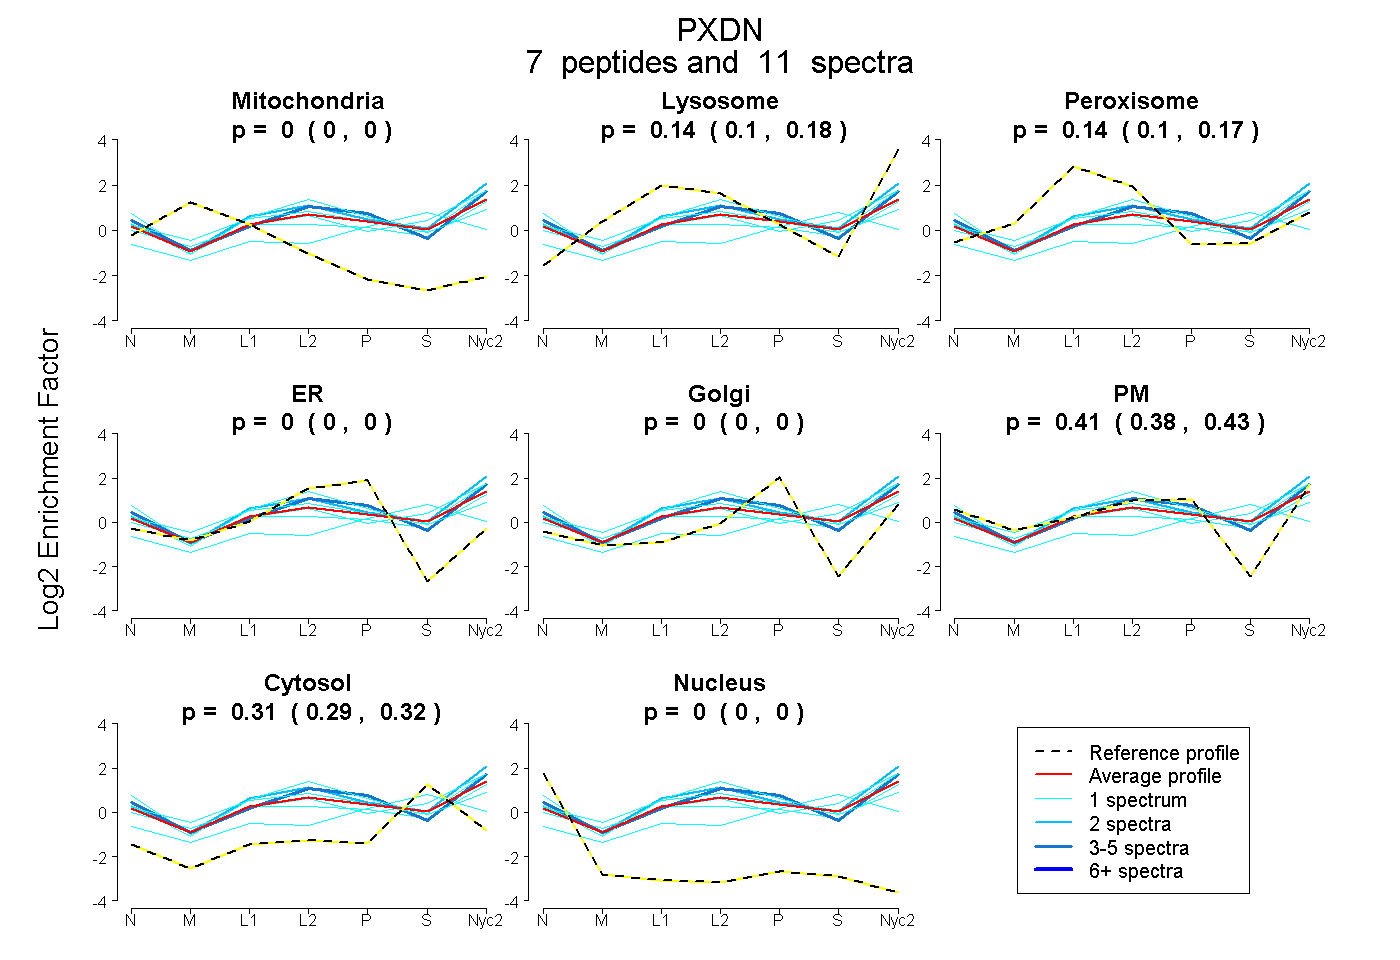
| Plot | Mito | Lyso | Perox | ER | Golgi | PM | Cytosol | Nucleus | |||||
| Expt A |
7 peptides |
11 spectra |
|
0.000 0.000 | 0.000 |
0.144 0.096 | 0.185 |
0.136 0.095 | 0.172 |
0.000 0.000 | 0.000 |
0.000 0.000 | 0.000 |
0.409 0.382 | 0.433 |
0.310 0.292 | 0.324 |
0.000 0.000 | 0.000 |
| 2 spectra, AFFSPFR | 0.000 | 0.312 | 0.095 | 0.000 | 0.000 | 0.360 | 0.233 | 0.000 | ||
| 1 spectrum, VVIEGQTVDFQCEAK | 0.000 | 0.000 | 0.326 | 0.000 | 0.000 | 0.427 | 0.247 | 0.000 | ||
| 1 spectrum, DPYTVGQAR | 0.000 | 0.000 | 0.155 | 0.000 | 0.000 | 0.543 | 0.302 | 0.000 | ||
| 1 spectrum, IAAELLK | 0.000 | 0.326 | 0.075 | 0.000 | 0.000 | 0.243 | 0.356 | 0.000 | ||
| 4 spectra, LFLHNNR | 0.000 | 0.152 | 0.063 | 0.000 | 0.000 | 0.571 | 0.215 | 0.000 | ||
| 1 spectrum, VVAHLTVQPR | 0.000 | 0.195 | 0.169 | 0.000 | 0.000 | 0.422 | 0.214 | 0.000 | ||
| 1 spectrum, DGVQVTESGK | 0.000 | 0.024 | 0.162 | 0.000 | 0.238 | 0.000 | 0.576 | 0.000 |
| Plot | Mito | Lyso or Perox | ER | Golgi | PM | Cytosol | Nucleus | ||||||
| Expt B |
1 peptide |
1 spectrum |
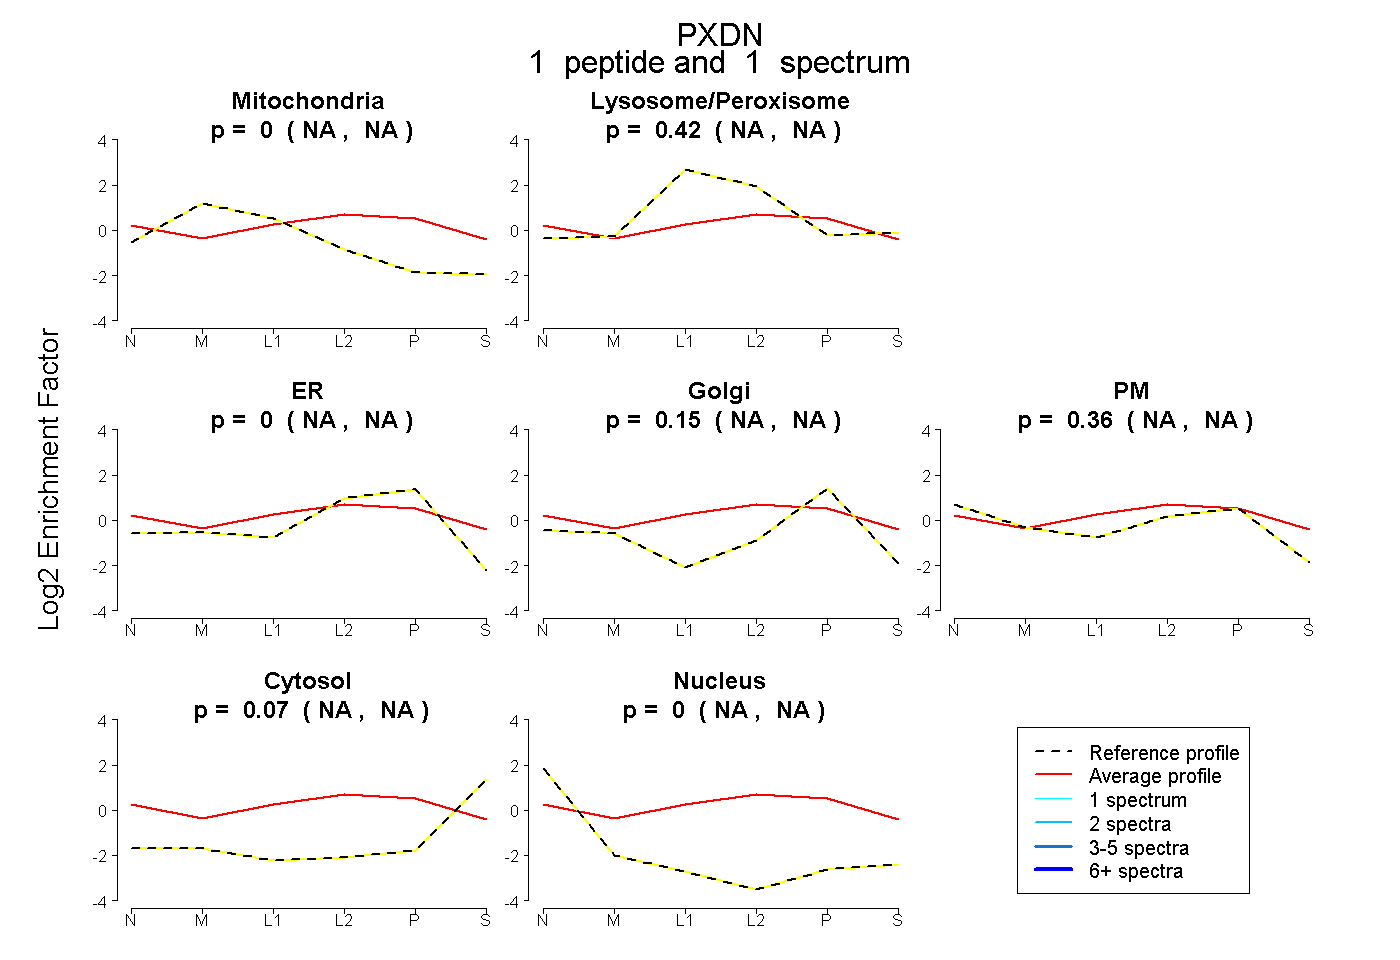 |
0.000 NA | NA |
0.424 NA | NA |
0.000 NA | NA |
0.148 NA | NA |
0.361 NA | NA |
0.067 NA | NA |
0.000 NA | NA |
|||
| Plot | Lyso | Other | |||||||||||
| Expt C |
8 peptides |
13 spectra |
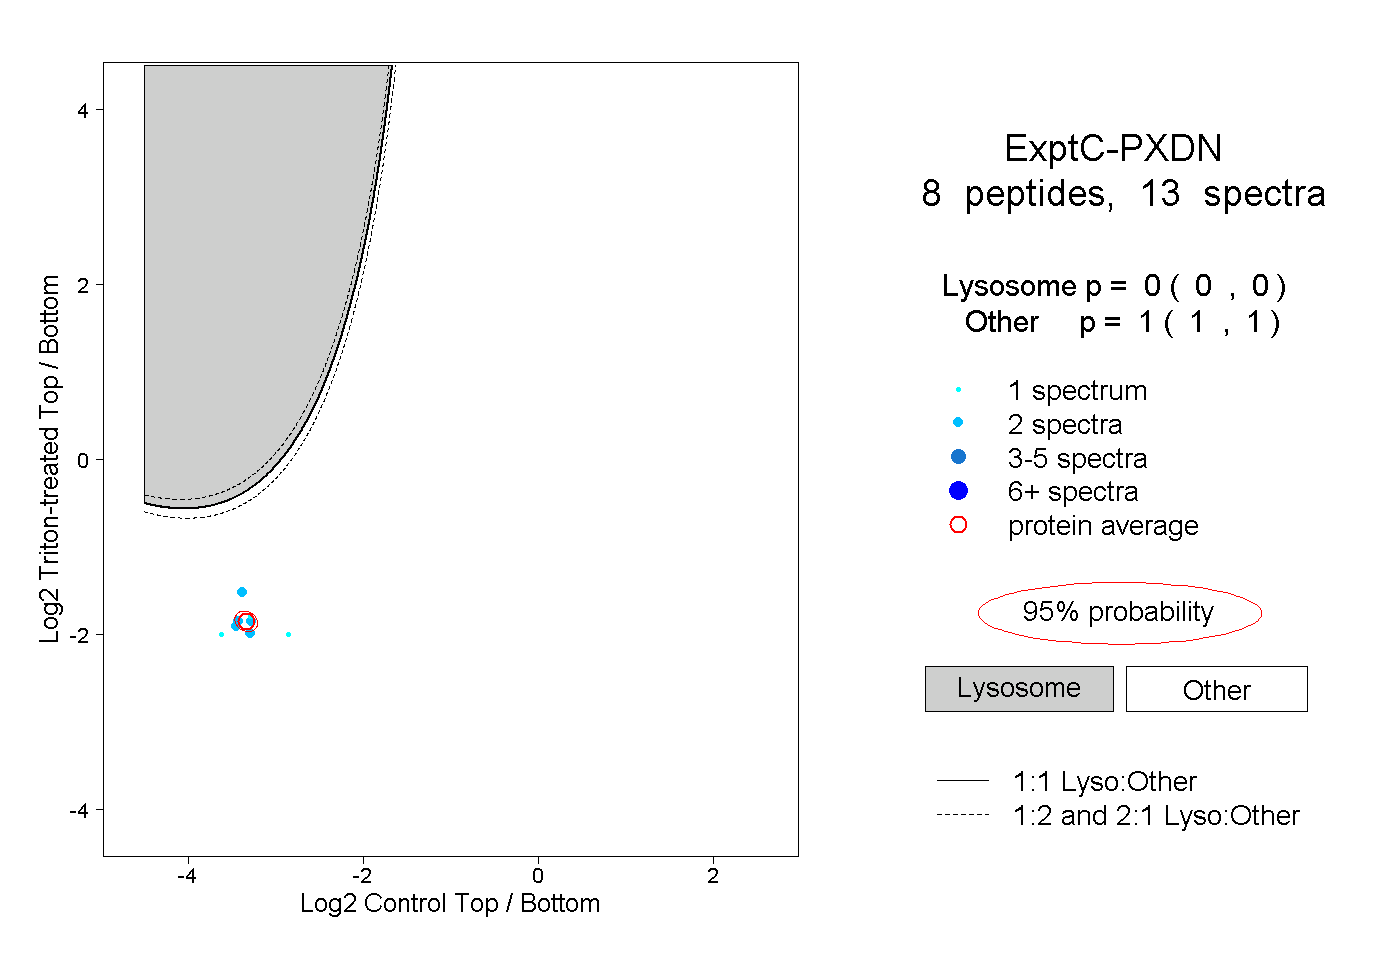 |
0.000 0.000 | 0.000 |
1.000 1.000 | 1.000 |
||||||||
| Plot | Lyso | Other | |||||||||||
| Expt D |
1 peptide |
2 spectra |
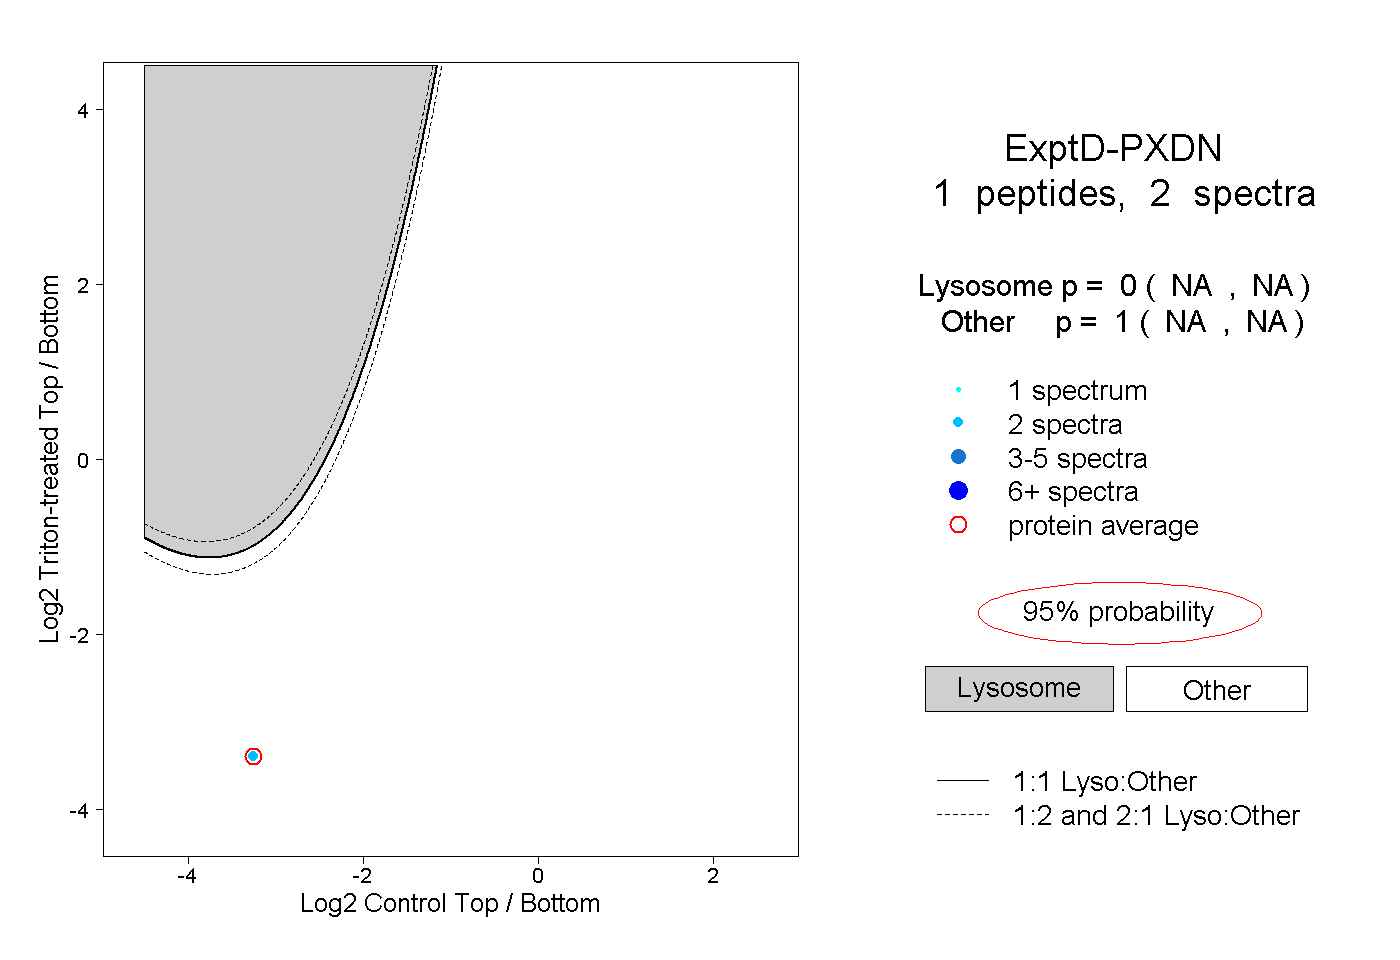 |
0.000 NA | NA |
1.000 NA | NA |