 9
9peptides
spectra
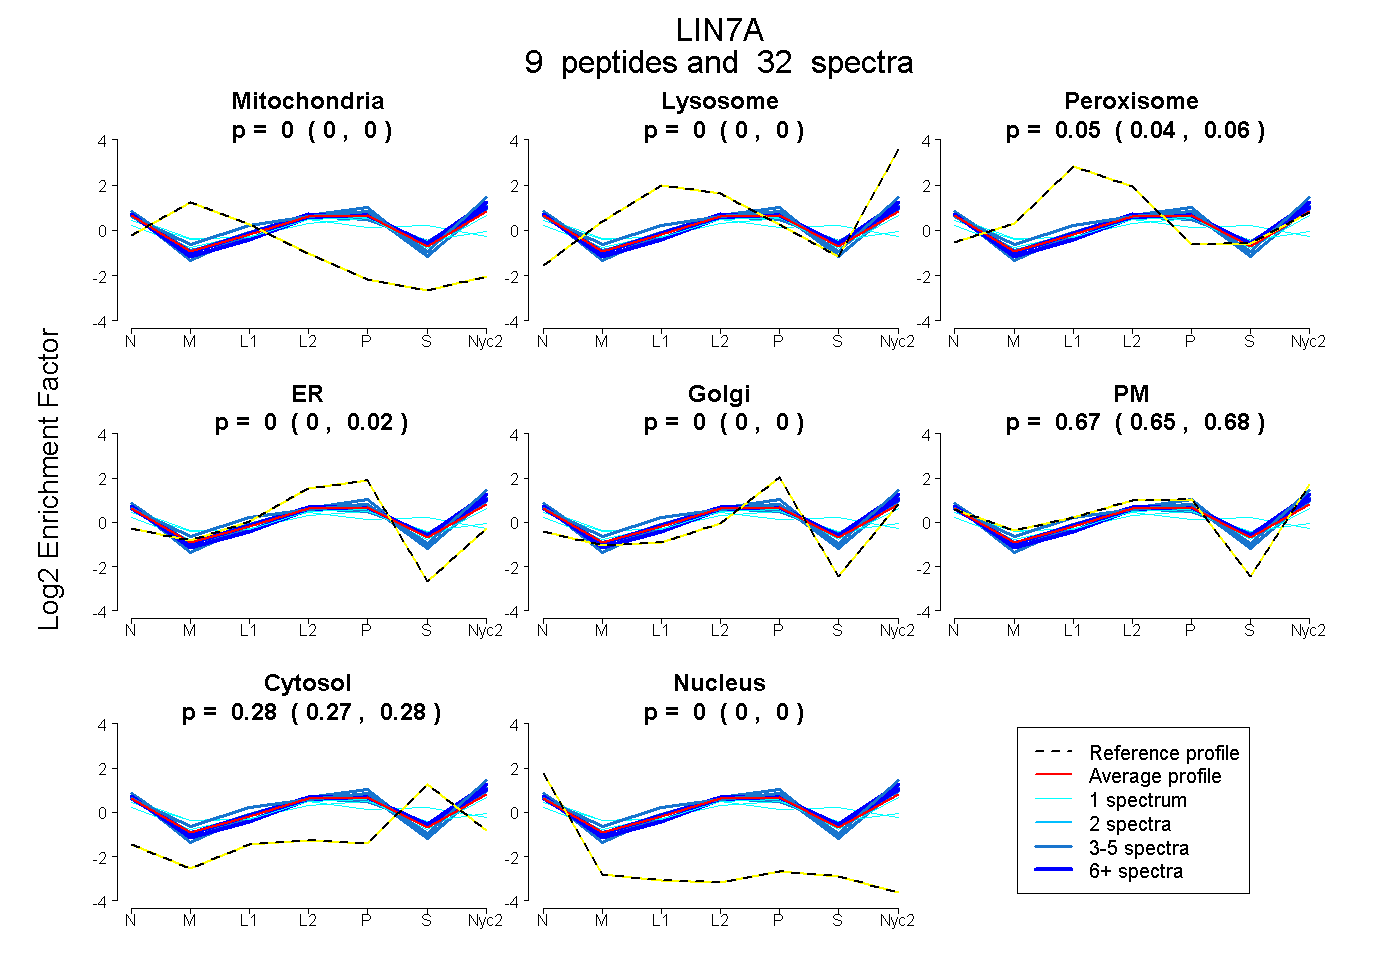
0.000 | 0.000
0.000 | 0.000
0.042 | 0.055
0.000 | 0.019
0.000 | 0.000
0.648 | 0.682
0.271 | 0.281
0.000 | 0.000
2peptides
spectra
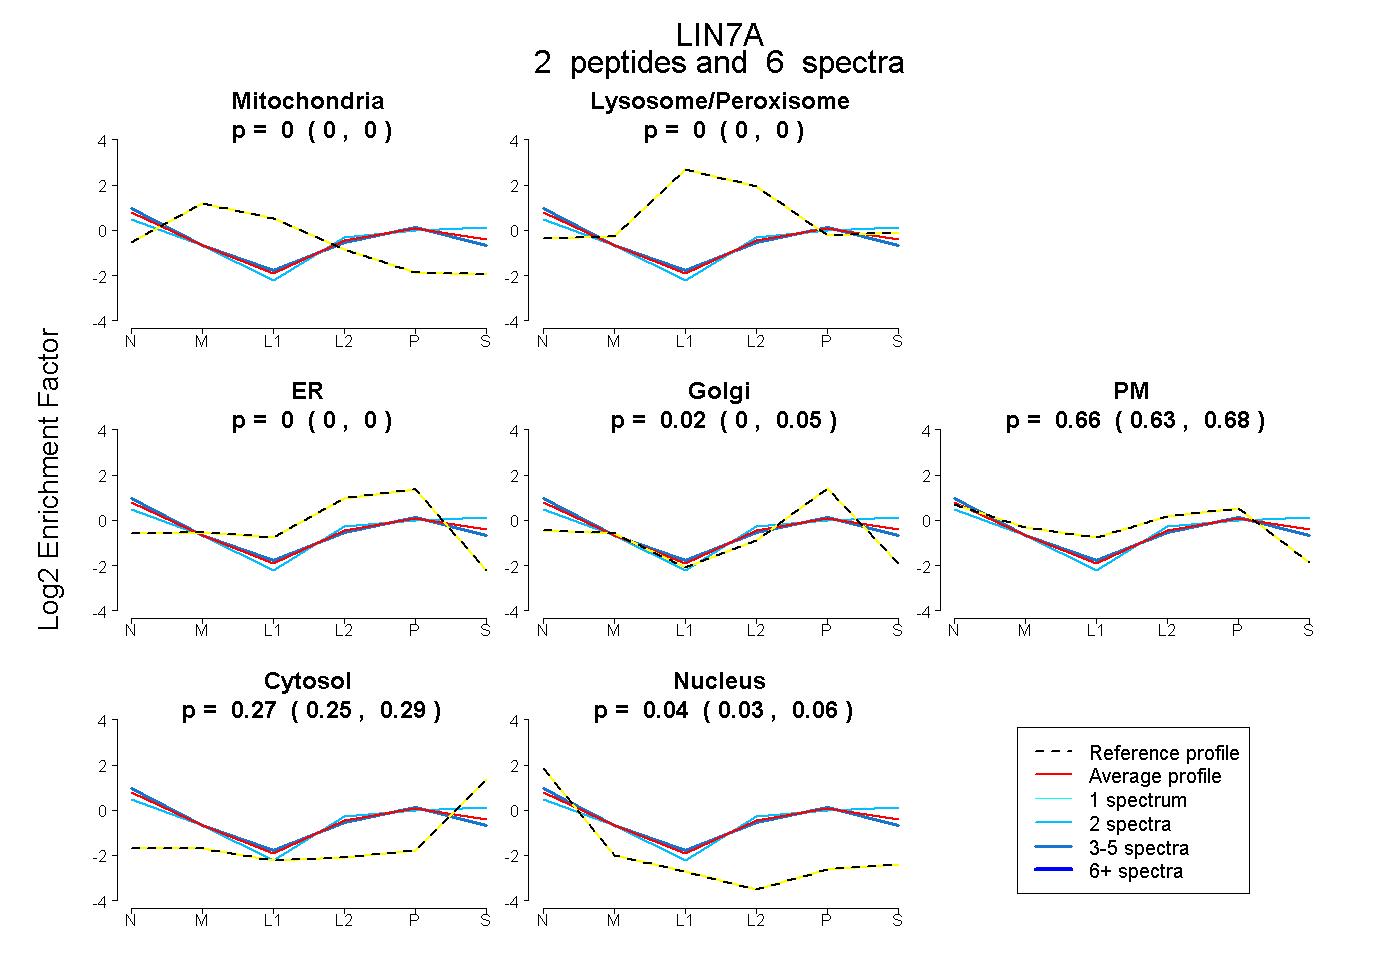
0.000 | 0.000
0.000 | 0.000
0.000 | 0.000
0.000 | 0.049
0.635 | 0.684
0.246 | 0.293
0.028 | 0.058
8peptides
spectra
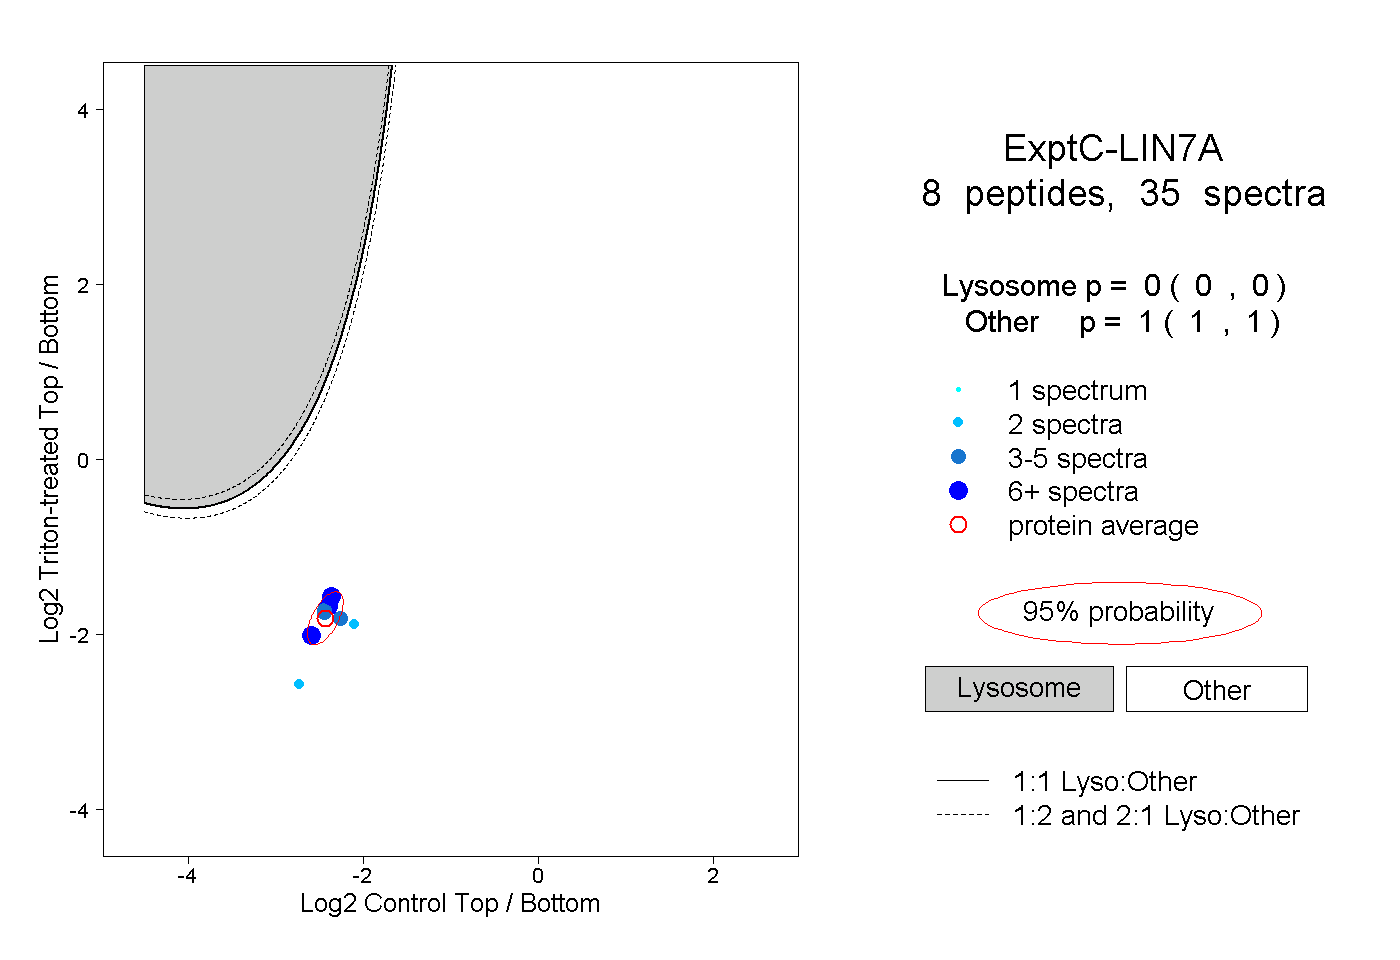
0.000 | 0.000
1.000 | 1.000
1peptide
spectra
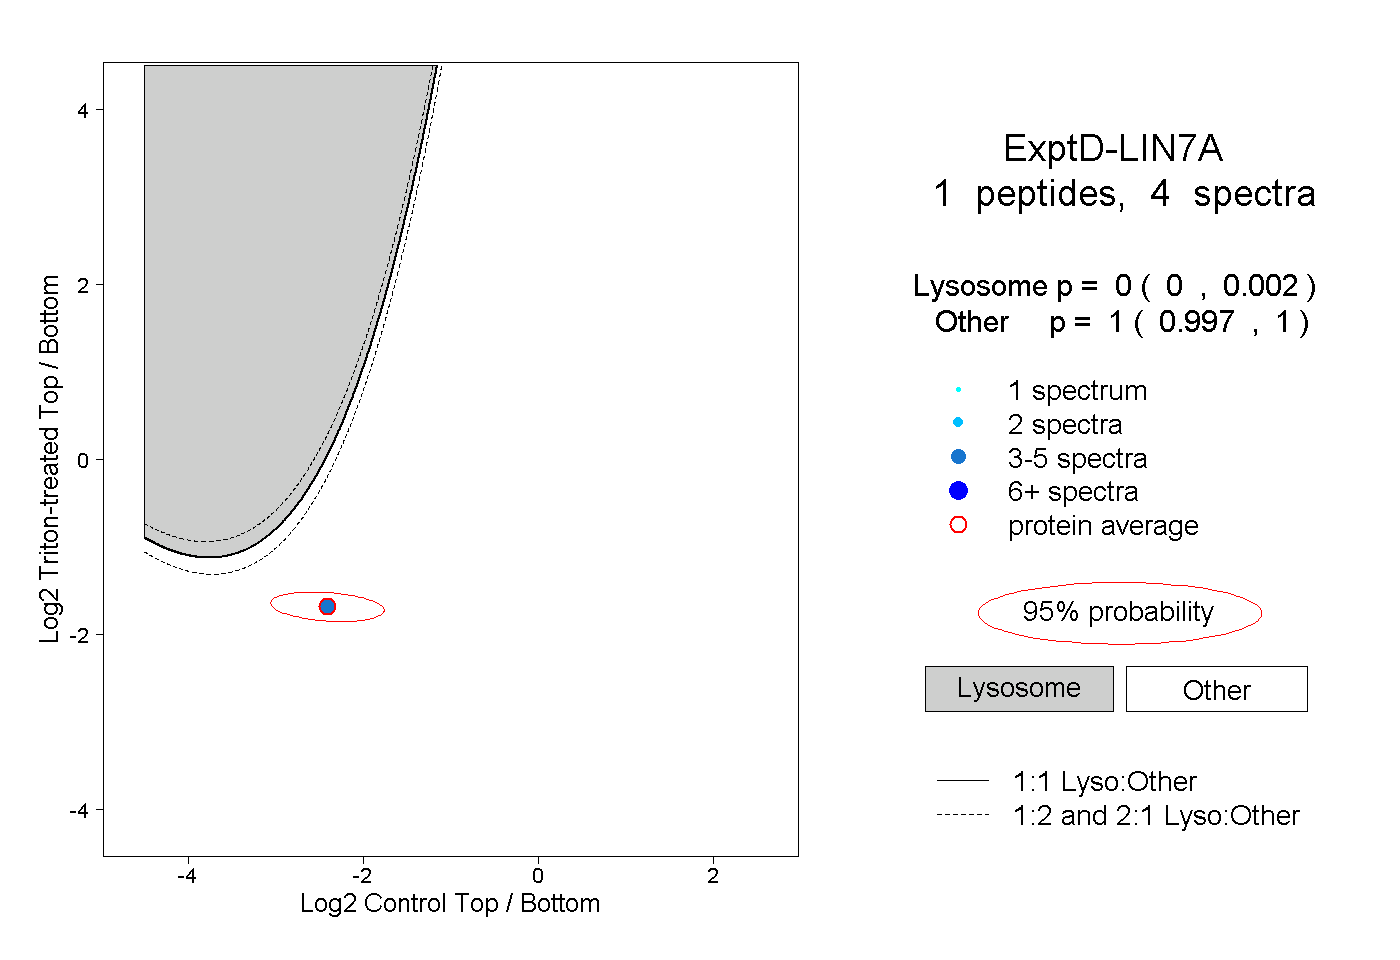
0.000 | 0.002
0.997 | 1.000