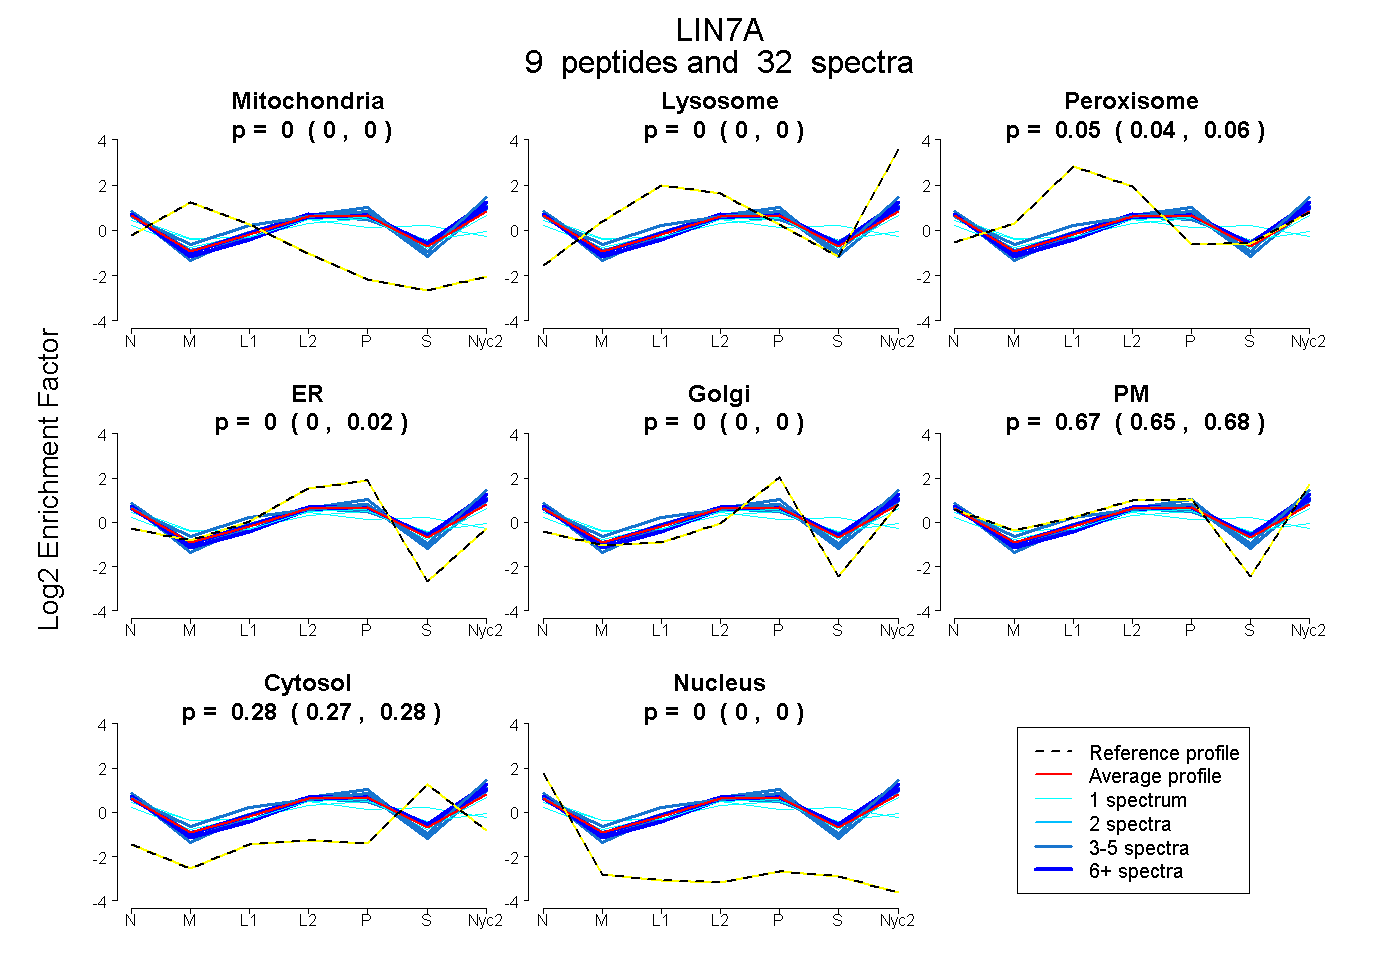
 9
9peptides
spectra
0.000 | 0.000
0.000 | 0.000
0.042 | 0.055
0.000 | 0.019
0.000 | 0.000
0.648 | 0.682
0.271 | 0.281
0.000 | 0.000
| Plot | Mito | Lyso | Perox | ER | Golgi | PM | Cytosol | Nucleus | |||||
| Expt A |
9 peptides |
32 spectra |
|
0.000 0.000 | 0.000 |
0.000 0.000 | 0.000 |
0.049 0.042 | 0.055 |
0.001 0.000 | 0.019 |
0.000 0.000 | 0.000 |
0.673 0.648 | 0.682 |
0.277 0.271 | 0.281 |
0.000 0.000 | 0.000 |
| 1 spectrum, ATVAAFAASEGHSHPR | 0.000 | 0.000 | 0.228 | 0.158 | 0.000 | 0.188 | 0.416 | 0.011 | ||
| 4 spectra, ALELLEK | 0.000 | 0.000 | 0.000 | 0.056 | 0.000 | 0.718 | 0.226 | 0.000 | ||
| 4 spectra, EQNSPIYISR | 0.000 | 0.000 | 0.004 | 0.000 | 0.000 | 0.792 | 0.204 | 0.000 | ||
| 3 spectra, AVELLK | 0.000 | 0.000 | 0.045 | 0.000 | 0.000 | 0.652 | 0.303 | 0.000 | ||
| 4 spectra, VVELPK | 0.000 | 0.020 | 0.080 | 0.000 | 0.000 | 0.723 | 0.177 | 0.000 | ||
| 1 spectrum, GDQLLSVNGVSVEGEHHEK | 0.062 | 0.000 | 0.093 | 0.162 | 0.000 | 0.369 | 0.314 | 0.000 | ||
| 7 spectra, IIPGGVAER | 0.000 | 0.000 | 0.000 | 0.000 | 0.000 | 0.703 | 0.297 | 0.000 | ||
| 7 spectra, VLEEMEAR | 0.000 | 0.000 | 0.059 | 0.000 | 0.000 | 0.683 | 0.258 | 0.000 | ||
| 1 spectrum, LQESGEVPVHK | 0.022 | 0.000 | 0.048 | 0.000 | 0.000 | 0.667 | 0.262 | 0.000 |
| Plot | Mito | Lyso or Perox | ER | Golgi | PM | Cytosol | Nucleus | ||||||
| Expt B |
2 peptides |
6 spectra |
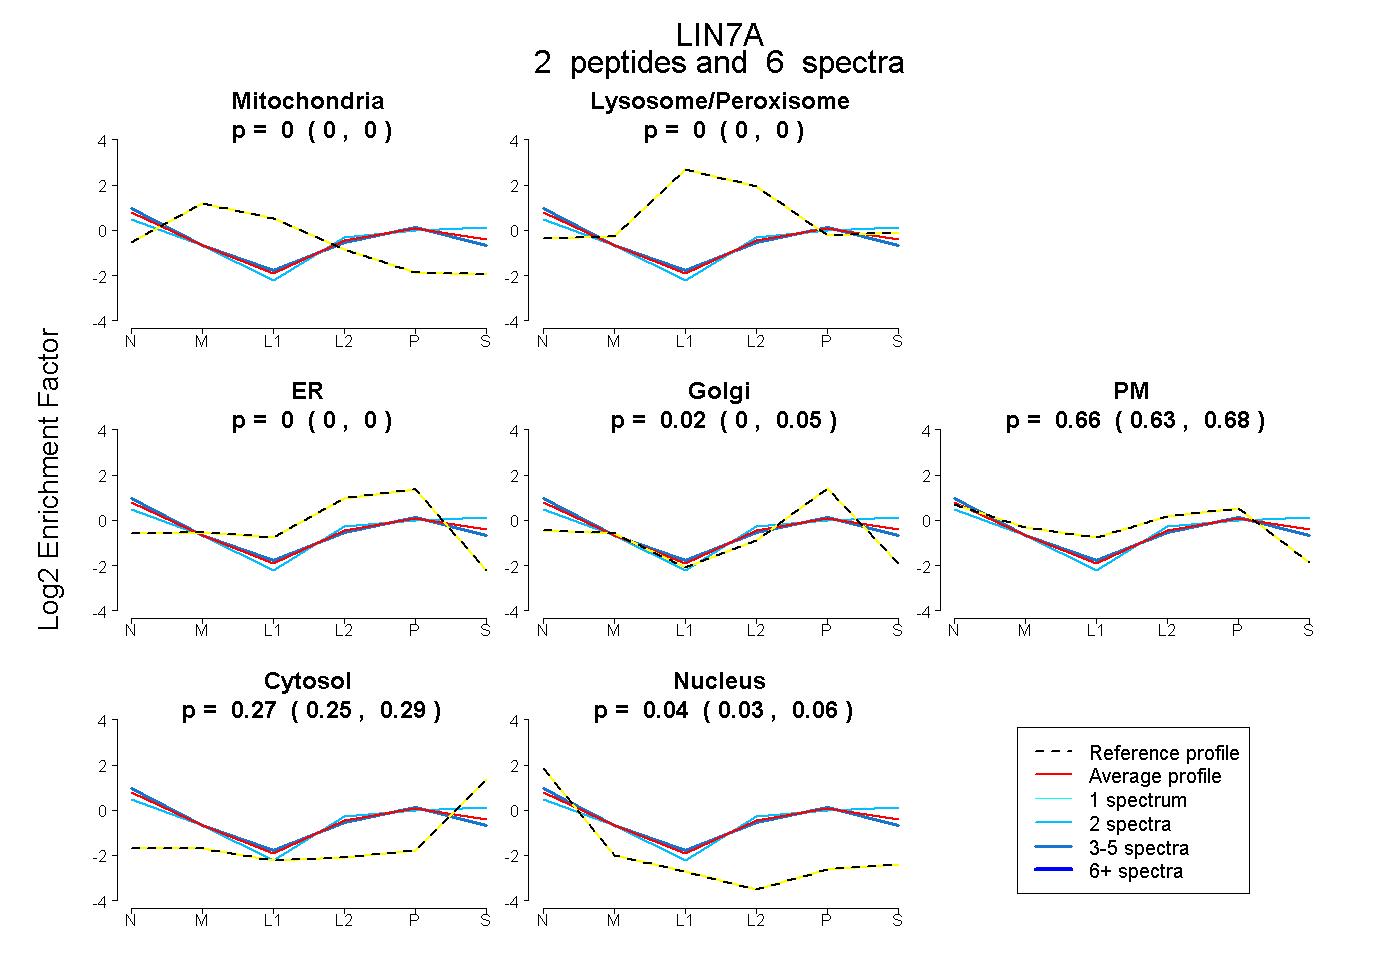 |
0.000 0.000 | 0.000 |
0.000 0.000 | 0.000 |
0.000 0.000 | 0.000 |
0.021 0.000 | 0.049 |
0.664 0.635 | 0.684 |
0.272 0.246 | 0.293 |
0.043 0.028 | 0.058 |
|||
| Plot | Lyso | Other | |||||||||||
| Expt C |
8 peptides |
35 spectra |
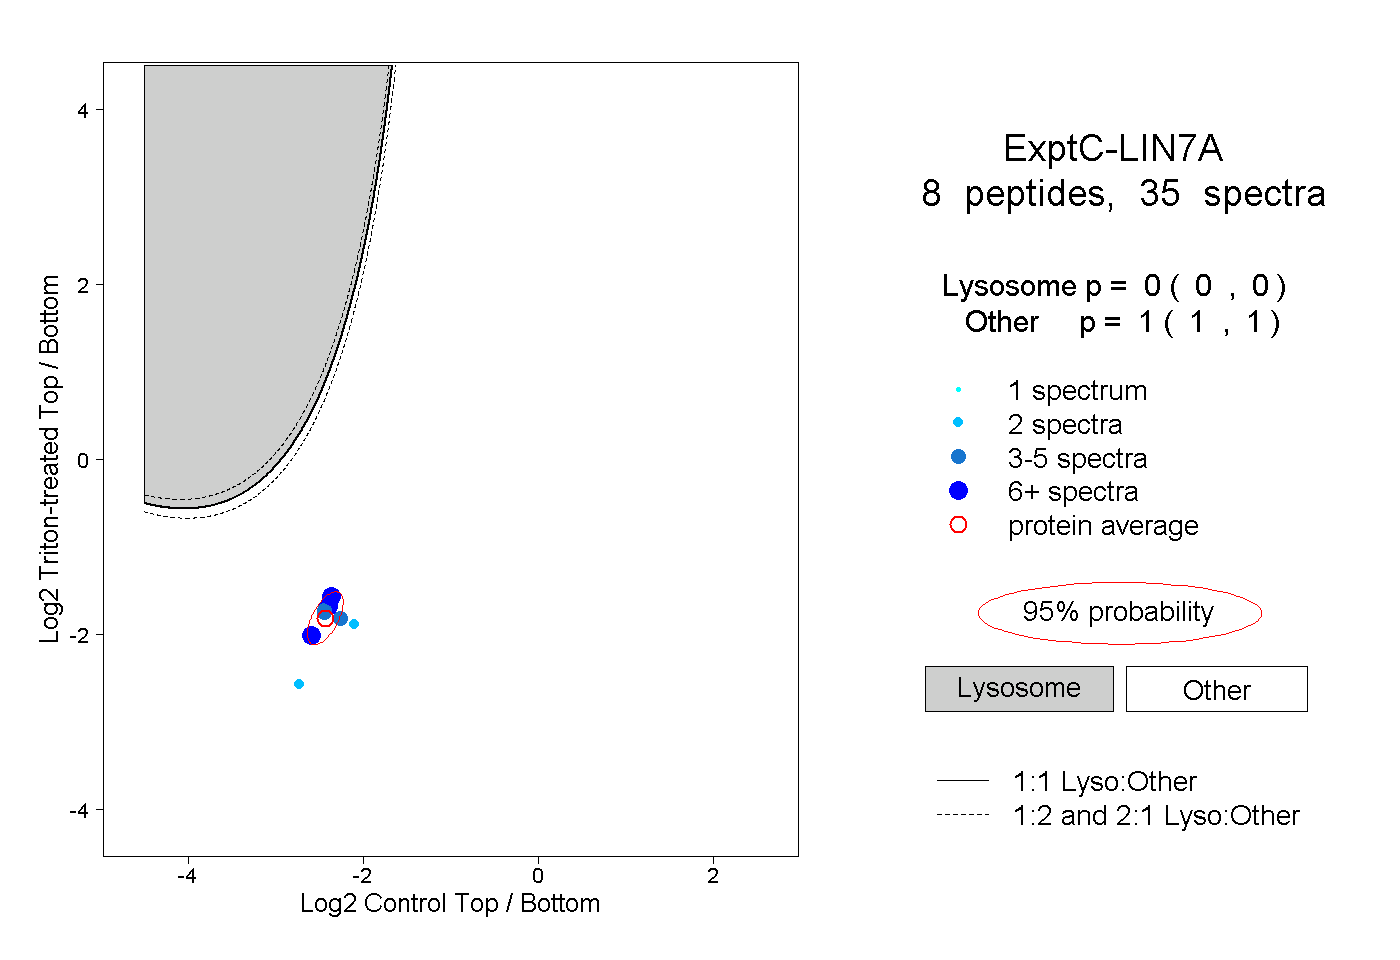 |
0.000 0.000 | 0.000 |
1.000 1.000 | 1.000 |
||||||||
| Plot | Lyso | Other | |||||||||||
| Expt D |
1 peptide |
4 spectra |
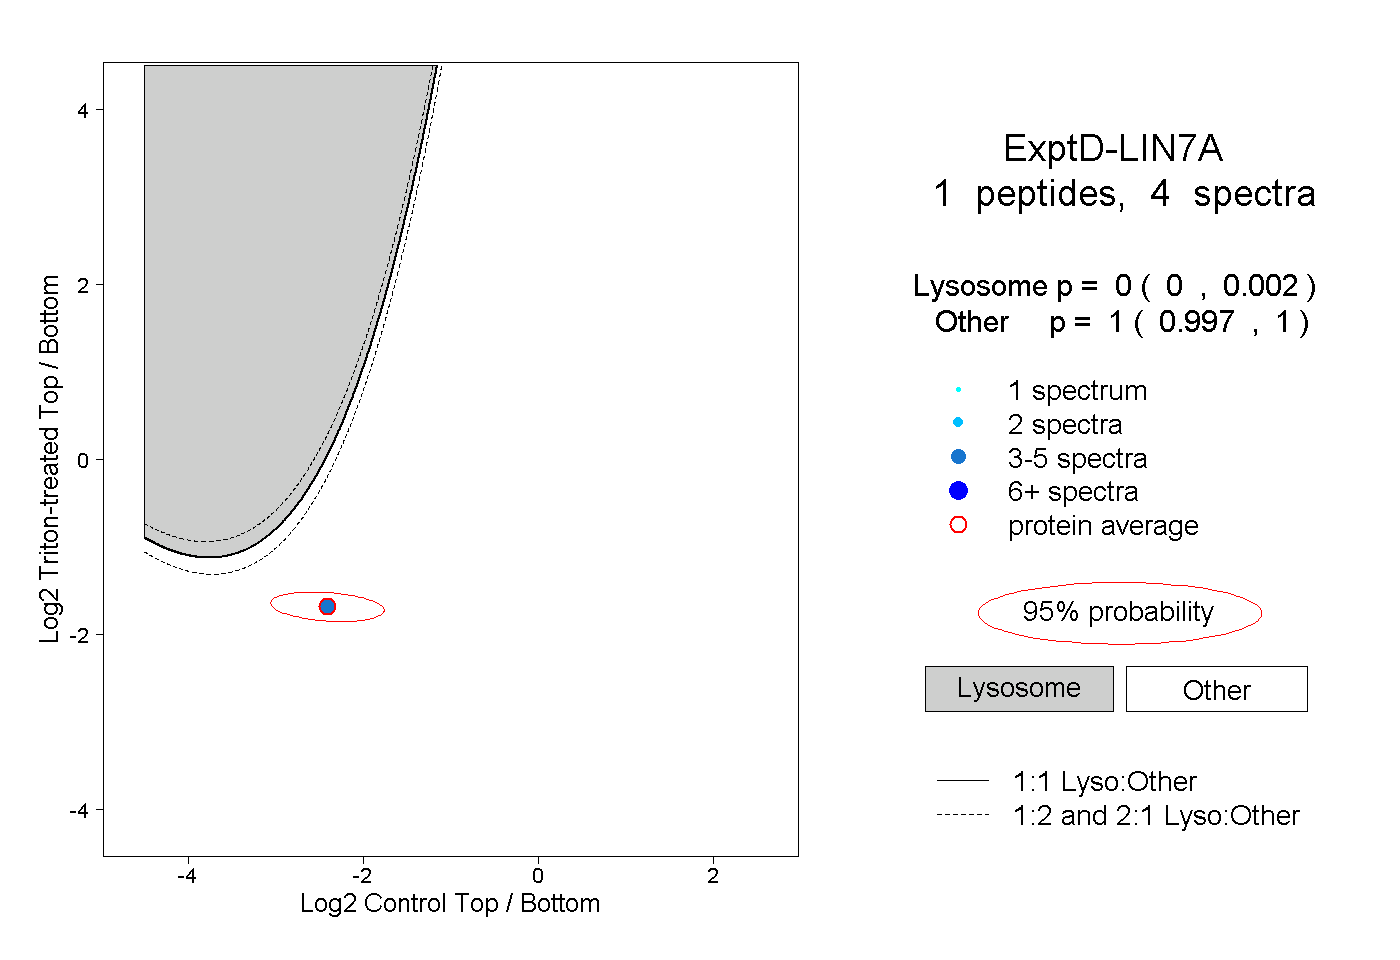 |
0.000 0.000 | 0.002 |
1.000 0.997 | 1.000 |