 4
4peptides
spectra
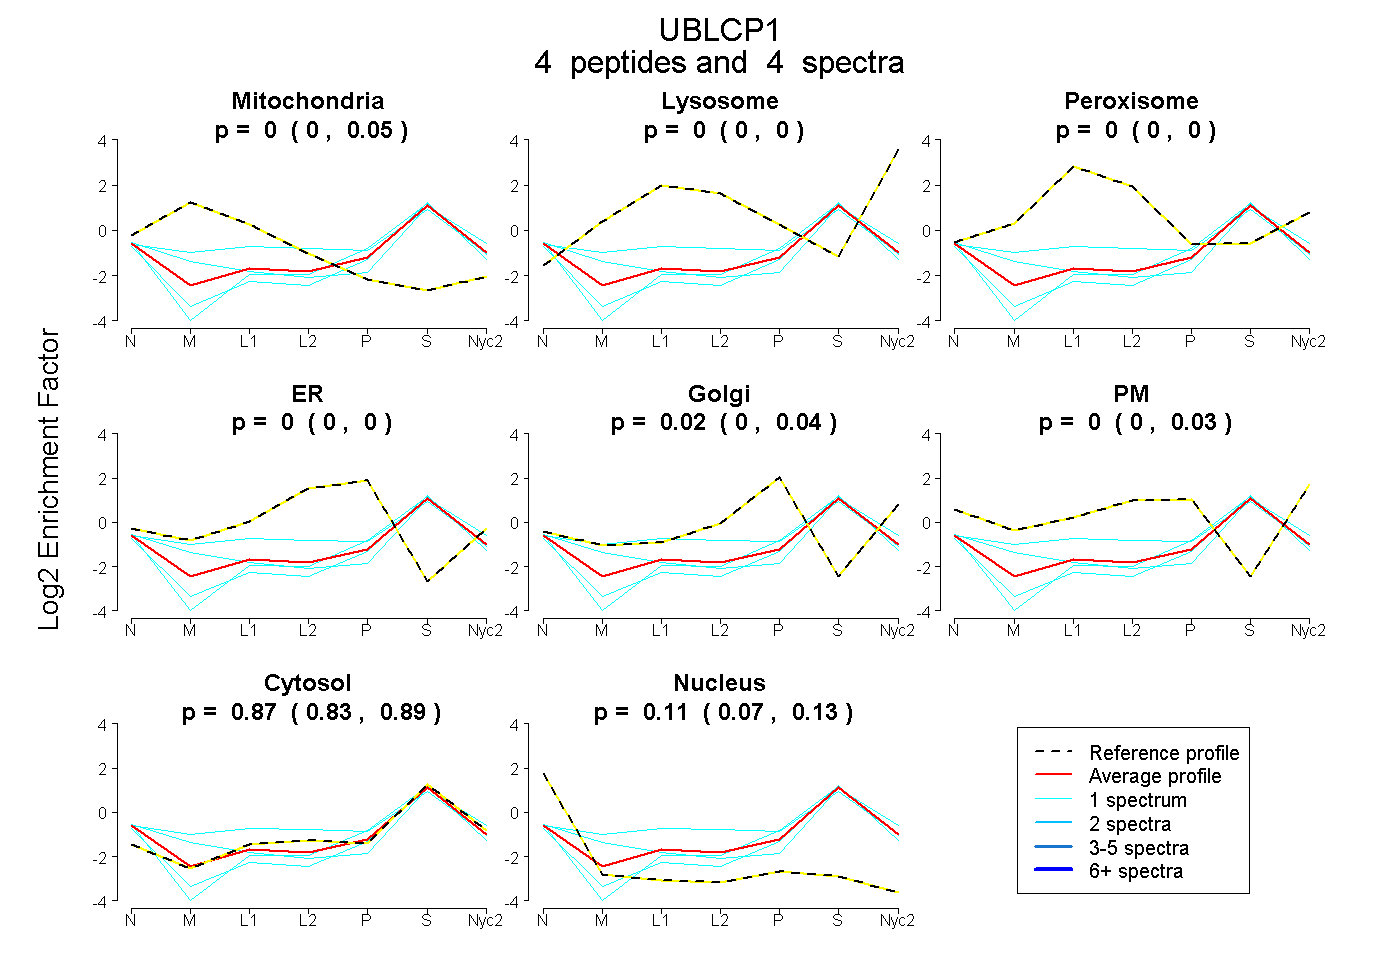
0.000 | 0.053
0.000 | 0.000
0.000 | 0.000
0.000 | 0.000
0.000 | 0.039
0.000 | 0.033
0.833 | 0.891
0.066 | 0.132
1peptide
spectra
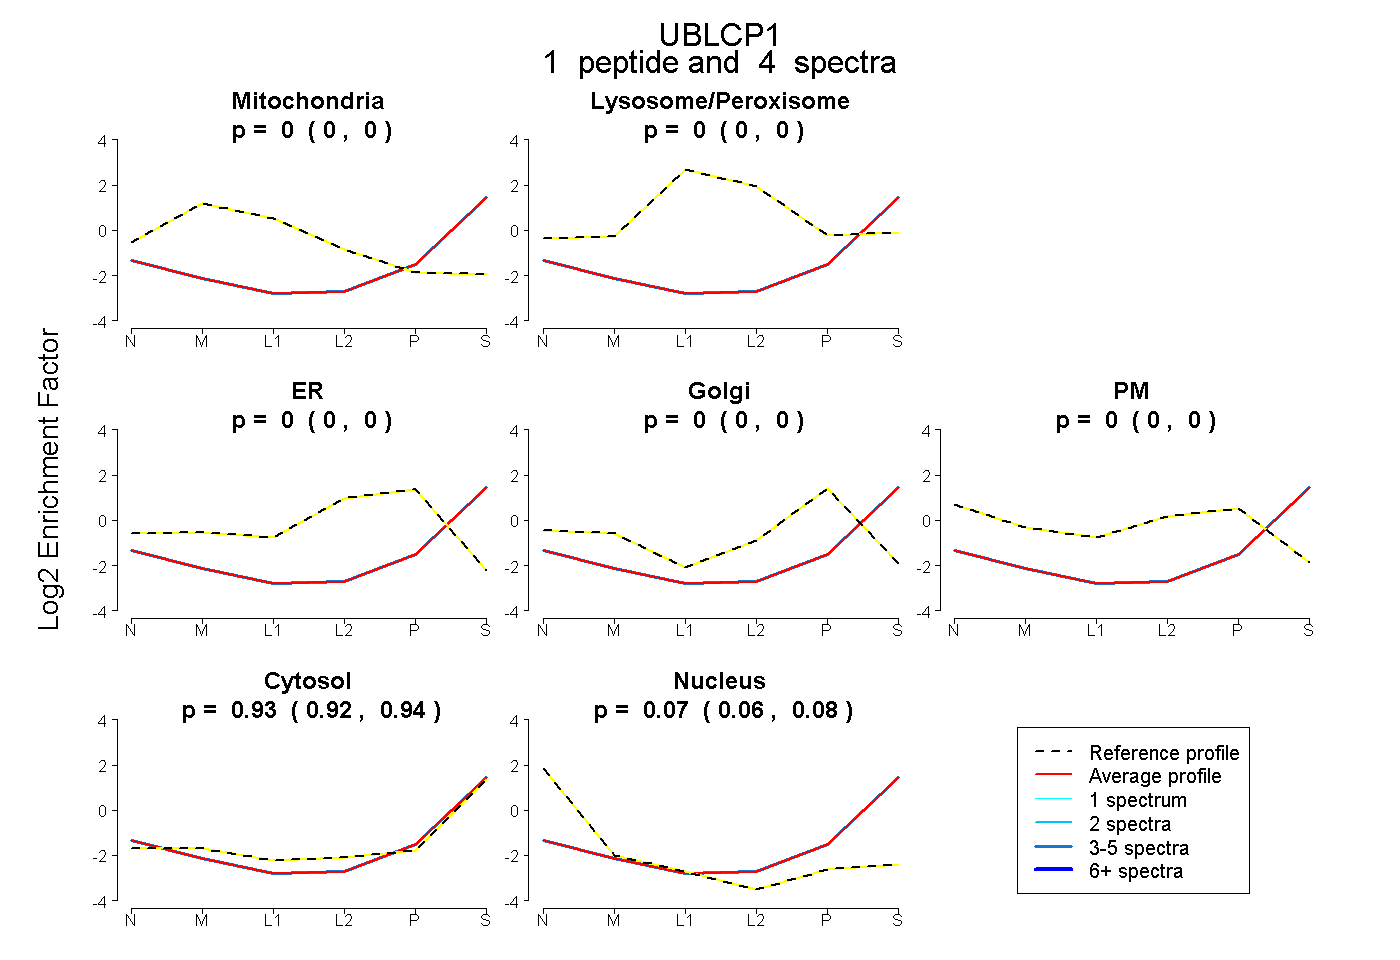
0.000 | 0.000
0.000 | 0.000
0.000 | 0.000
0.000 | 0.000
0.000 | 0.000
0.922 | 0.939
0.060 | 0.076
1peptide
spectrum
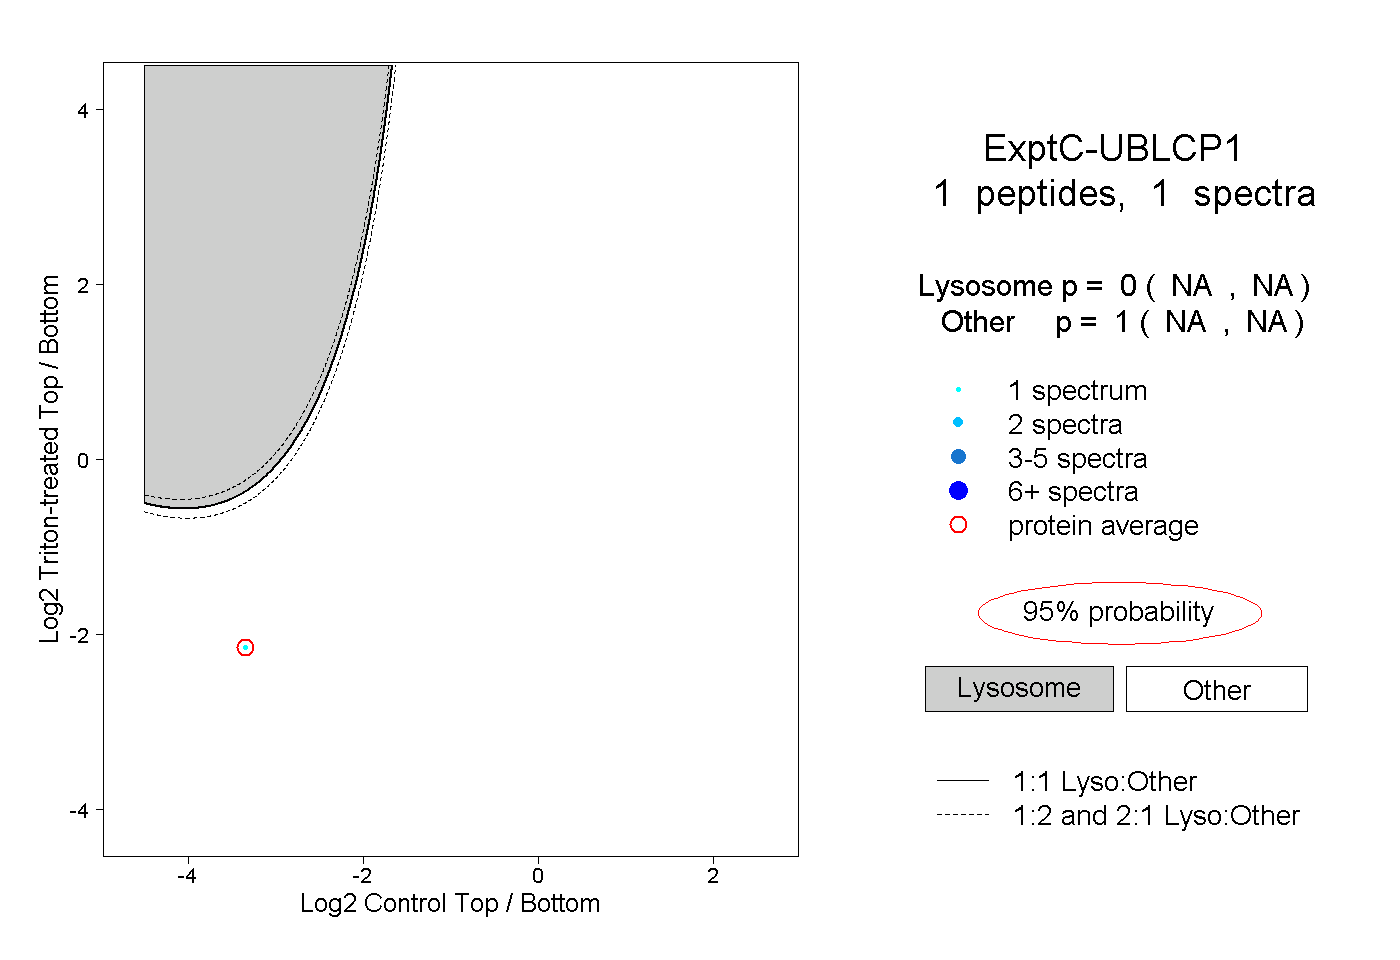
NA | NA
NA | NA