 4
4peptides
spectra
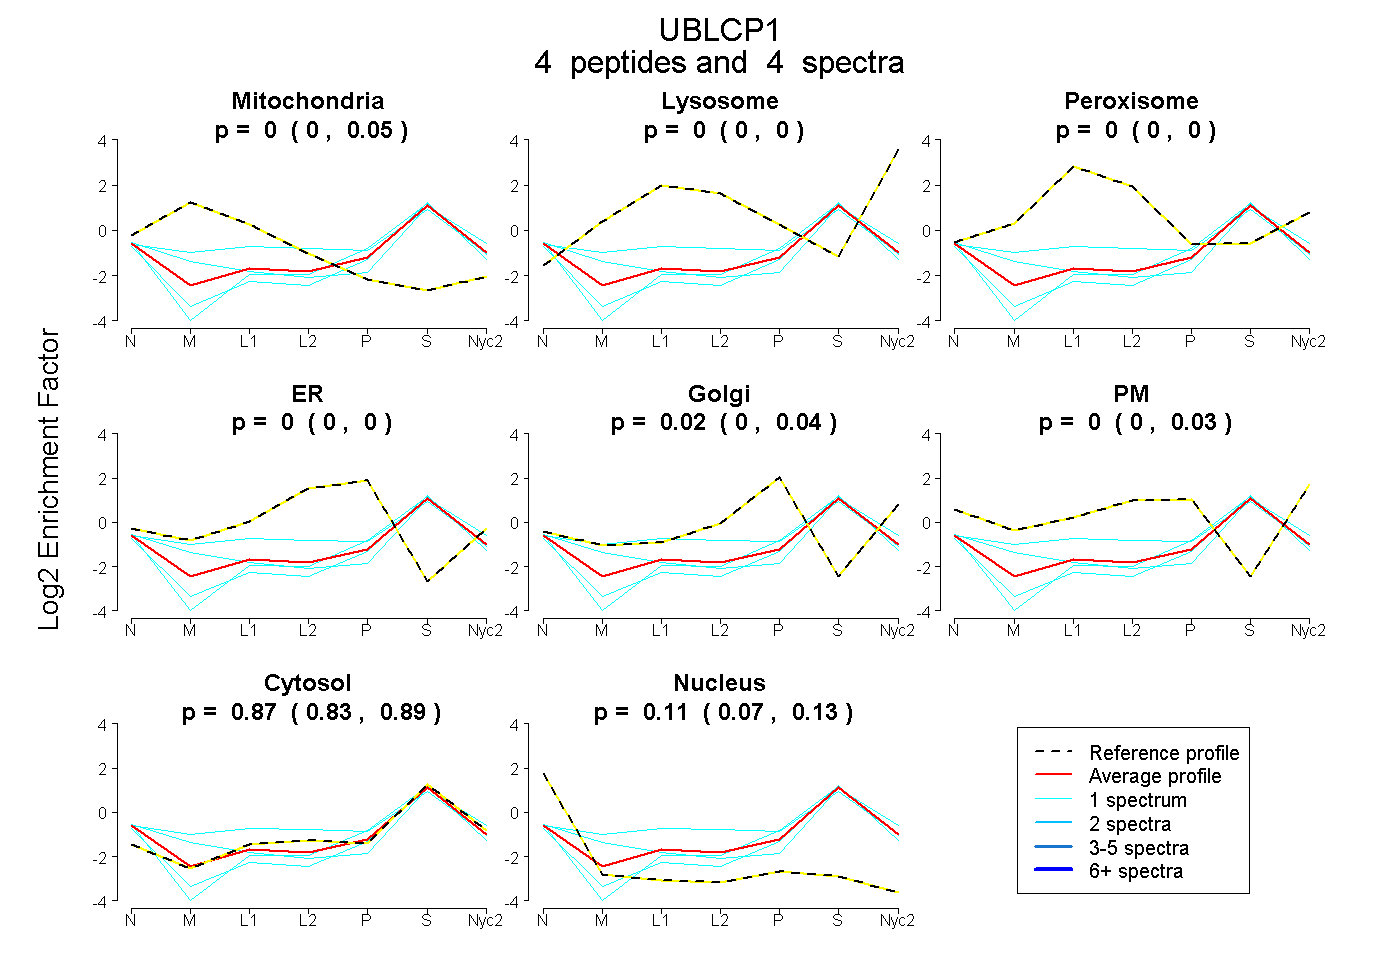
0.000 | 0.053
0.000 | 0.000
0.000 | 0.000
0.000 | 0.000
0.000 | 0.039
0.000 | 0.033
0.833 | 0.891
0.066 | 0.132
| Plot | Mito | Lyso | Perox | ER | Golgi | PM | Cytosol | Nucleus | |||||
| Expt A |
4 peptides |
4 spectra |
|
0.000 0.000 | 0.053 |
0.000 0.000 | 0.000 |
0.000 0.000 | 0.000 |
0.000 0.000 | 0.000 |
0.015 0.000 | 0.039 |
0.000 0.000 | 0.033 |
0.875 0.833 | 0.891 |
0.110 0.066 | 0.132 |
| 1 spectrum, LTQYLK | 0.146 | 0.000 | 0.134 | 0.030 | 0.001 | 0.000 | 0.689 | 0.000 | ||
| 1 spectrum, GKPAENDVK | 0.116 | 0.000 | 0.000 | 0.000 | 0.000 | 0.000 | 0.817 | 0.068 | ||
| 1 spectrum, TLTGVLPER | 0.000 | 0.000 | 0.000 | 0.000 | 0.000 | 0.000 | 0.872 | 0.128 | ||
| 1 spectrum, LDDFLELNHK | 0.000 | 0.000 | 0.000 | 0.000 | 0.000 | 0.000 | 0.831 | 0.169 |
| Plot | Mito | Lyso or Perox | ER | Golgi | PM | Cytosol | Nucleus | ||||||
| Expt B |
1 peptide |
4 spectra |
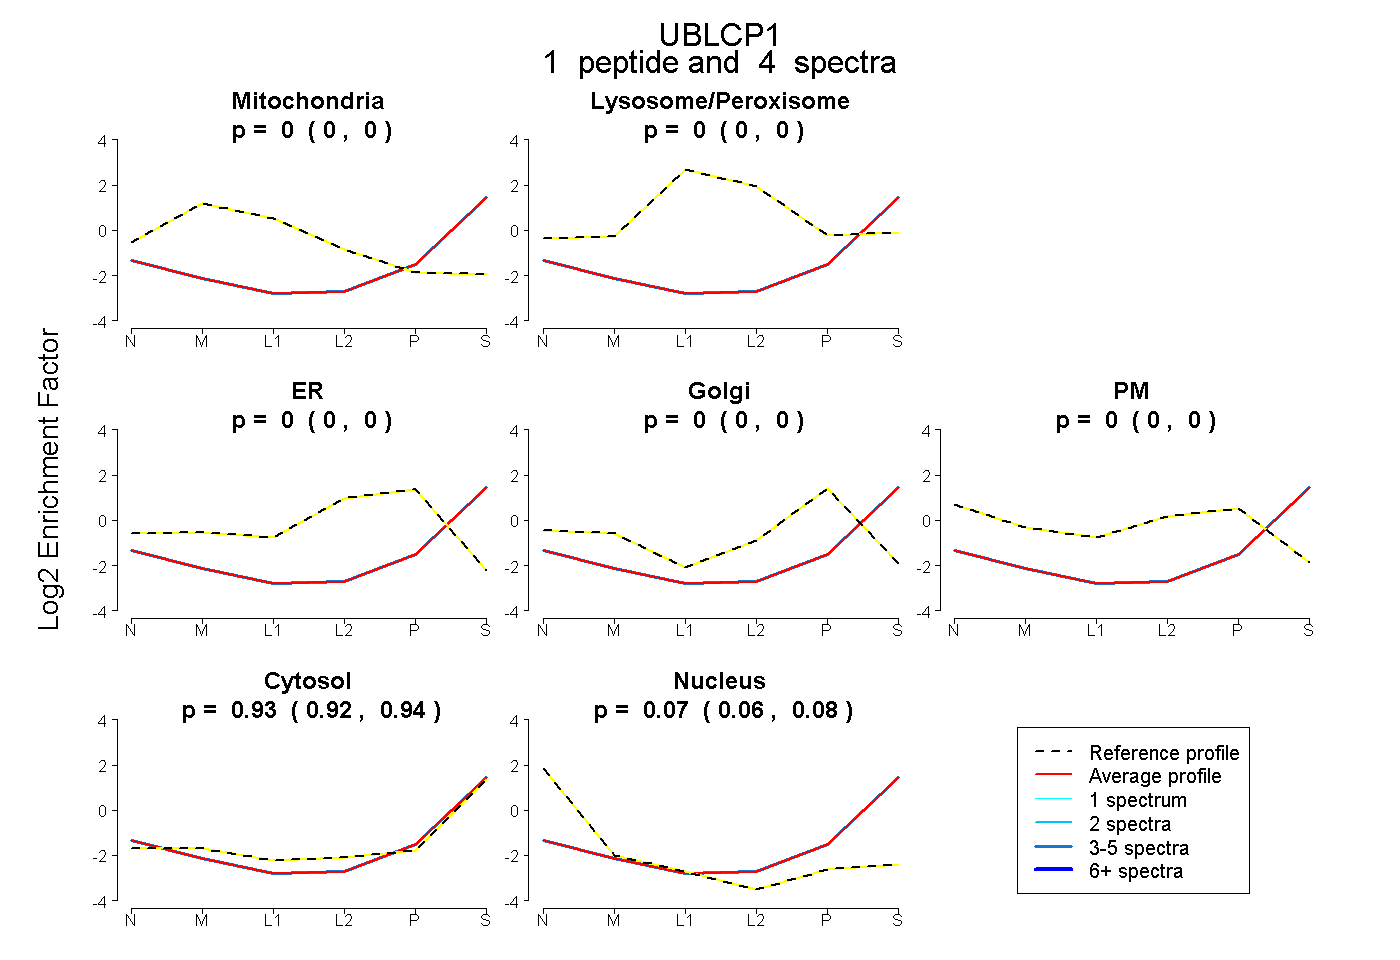 |
0.000 0.000 | 0.000 |
0.000 0.000 | 0.000 |
0.000 0.000 | 0.000 |
0.000 0.000 | 0.000 |
0.000 0.000 | 0.000 |
0.931 0.922 | 0.939 |
0.069 0.060 | 0.076 |
|||
| Plot | Lyso | Other | |||||||||||
| Expt C |
1 peptide |
1 spectrum |
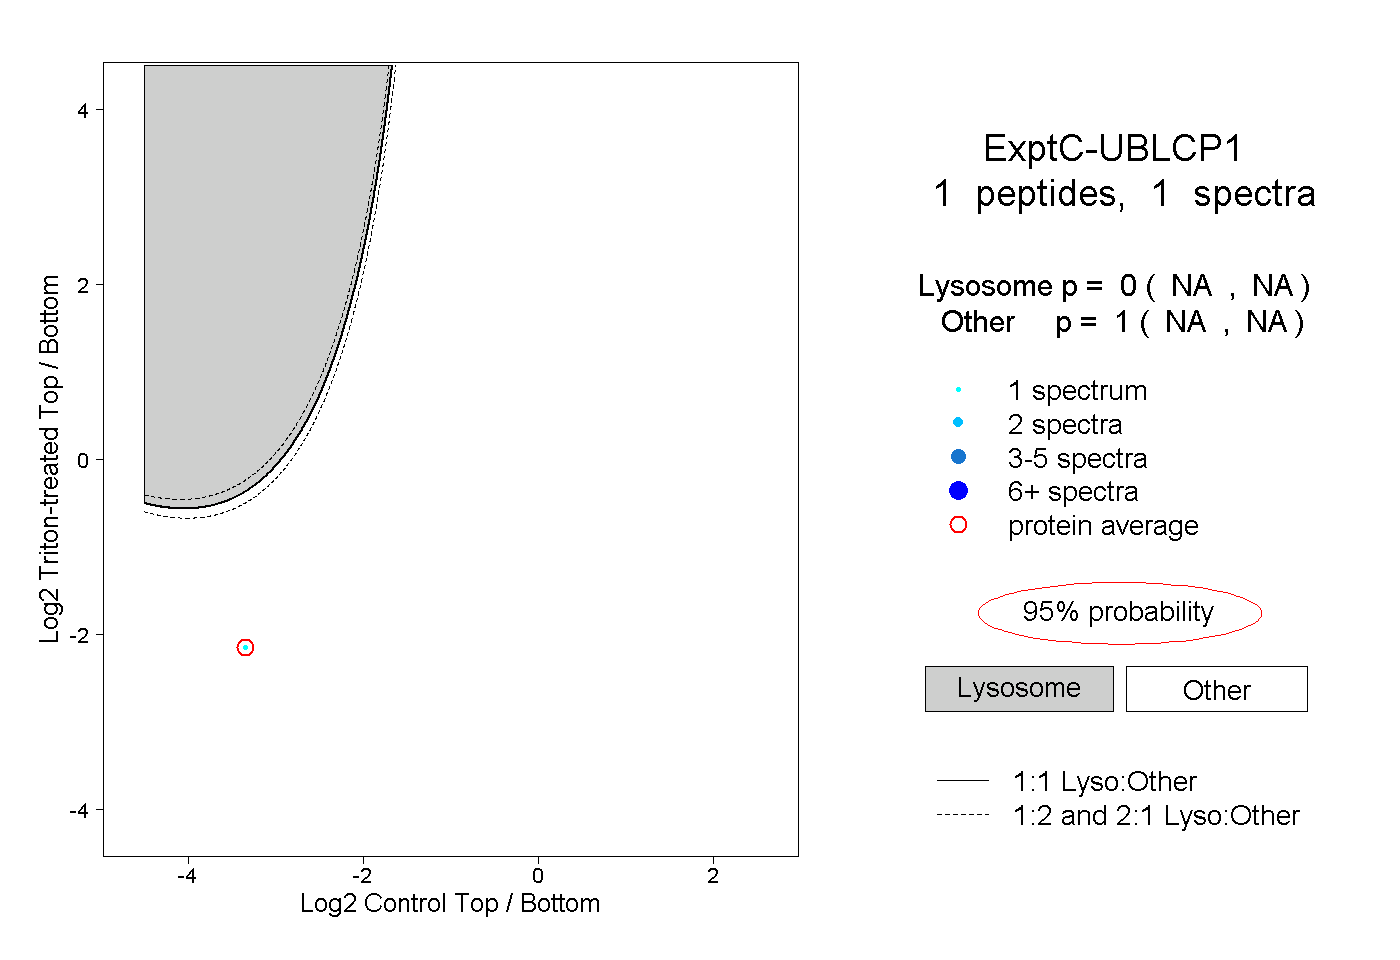 |
0.000 NA | NA |
1.000 NA | NA |