 27
27peptides
spectra
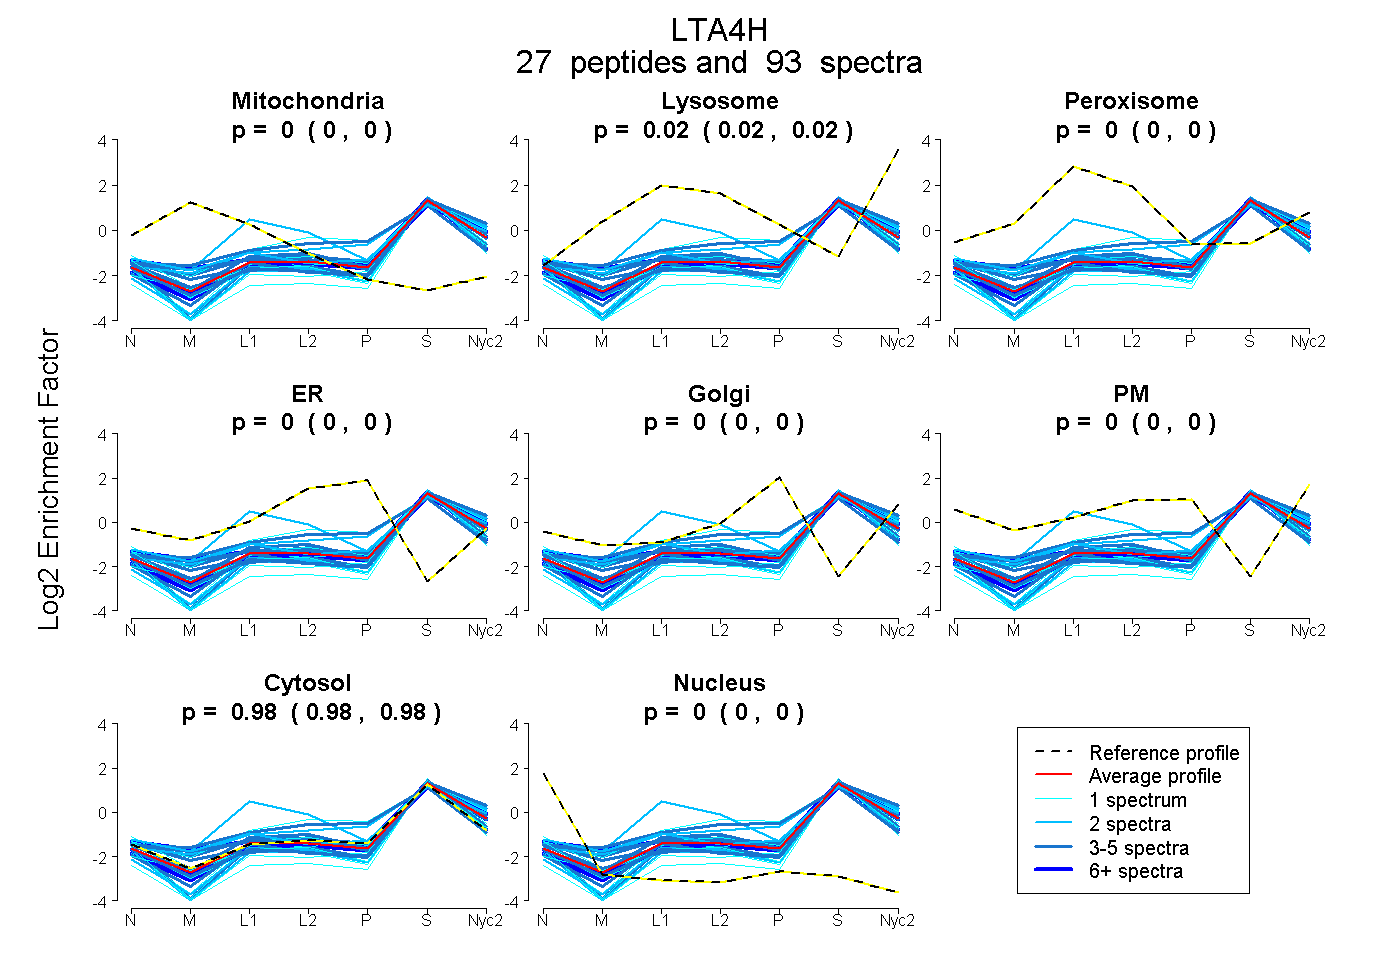
0.000 | 0.000
0.016 | 0.021
0.000 | 0.000
0.000 | 0.000
0.000 | 0.000
0.000 | 0.000
0.978 | 0.983
0.000 | 0.000
13peptides
spectra
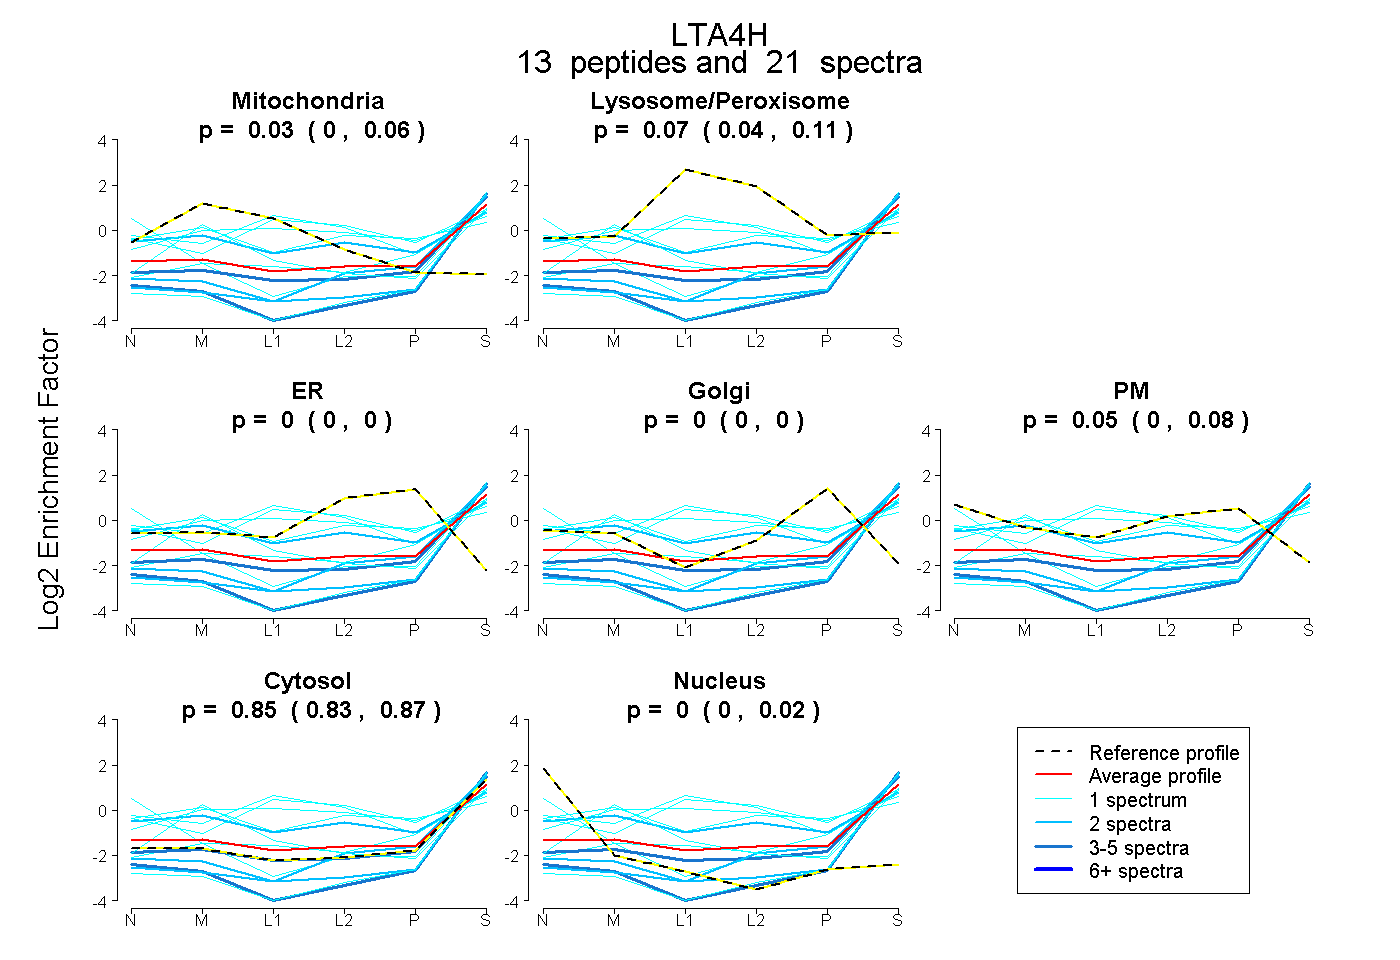
0.000 | 0.061
0.038 | 0.107
0.000 | 0.000
0.000 | 0.000
0.000 | 0.079
0.829 | 0.873
0.000 | 0.021
19peptides
spectra
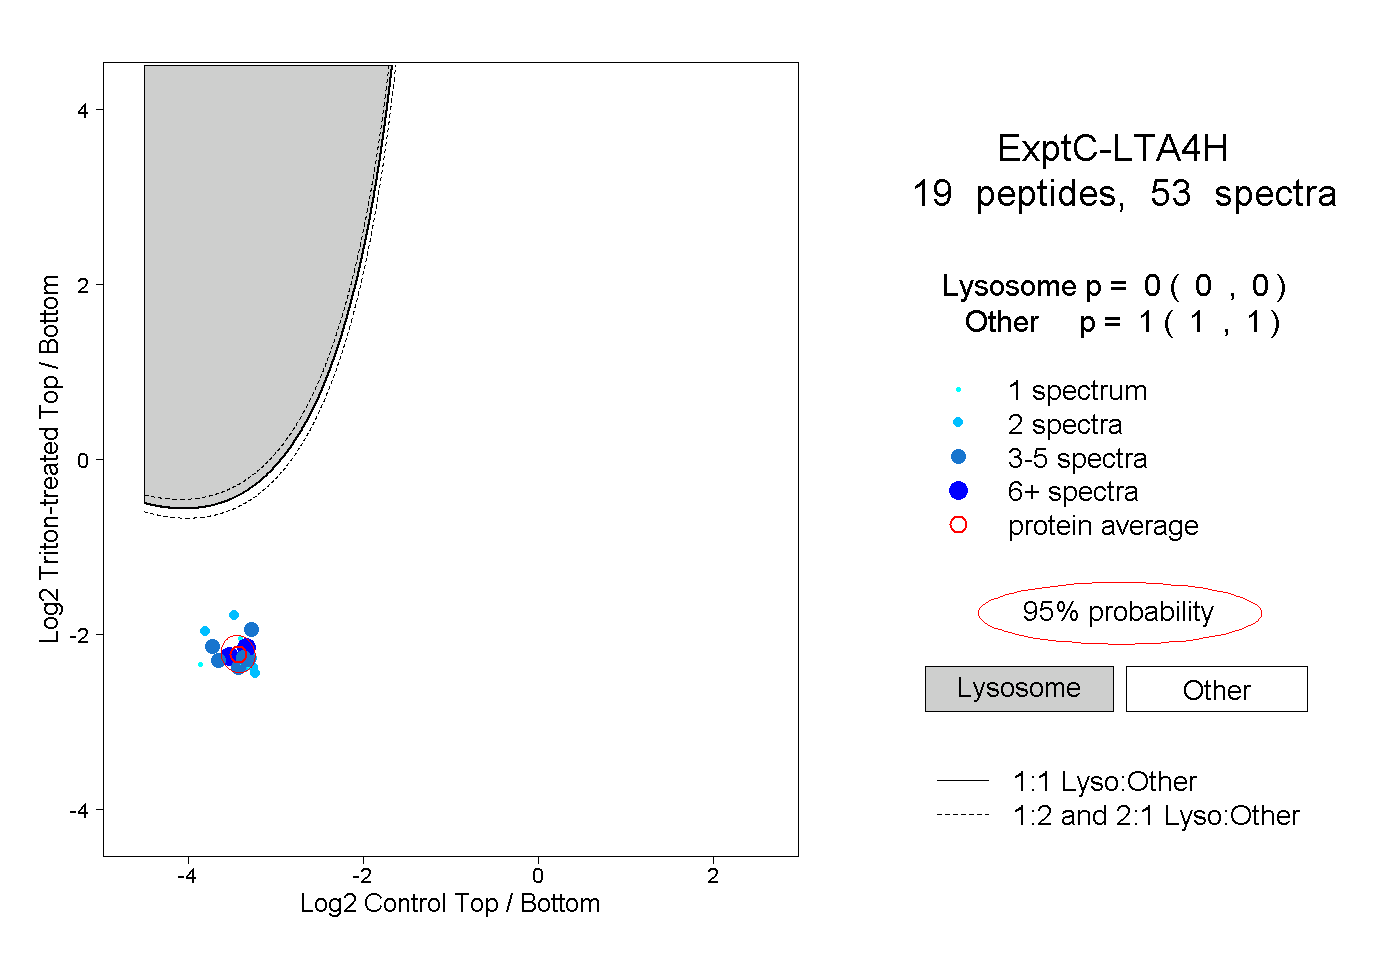
0.000 | 0.000
1.000 | 1.000
5peptides
spectra
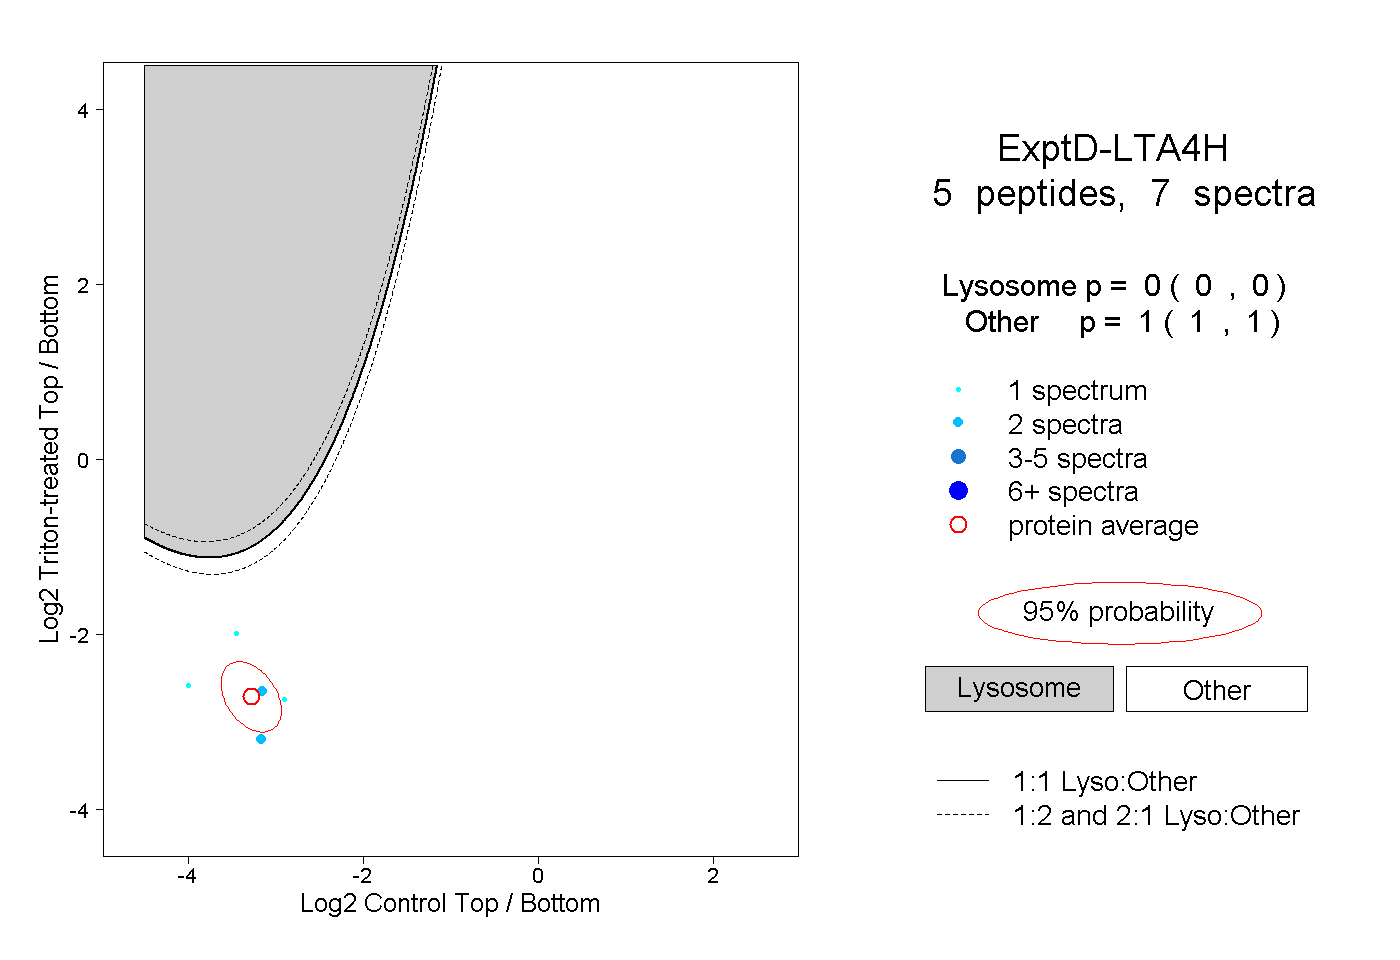
0.000 | 0.000
1.000 | 1.000