 27
27peptides
spectra
0.000 | 0.000
0.016 | 0.021
0.000 | 0.000
0.000 | 0.000
0.000 | 0.000
0.000 | 0.000
0.978 | 0.983
0.000 | 0.000
| Plot | Mito | Lyso | Perox | ER | Golgi | PM | Cytosol | Nucleus | |||||
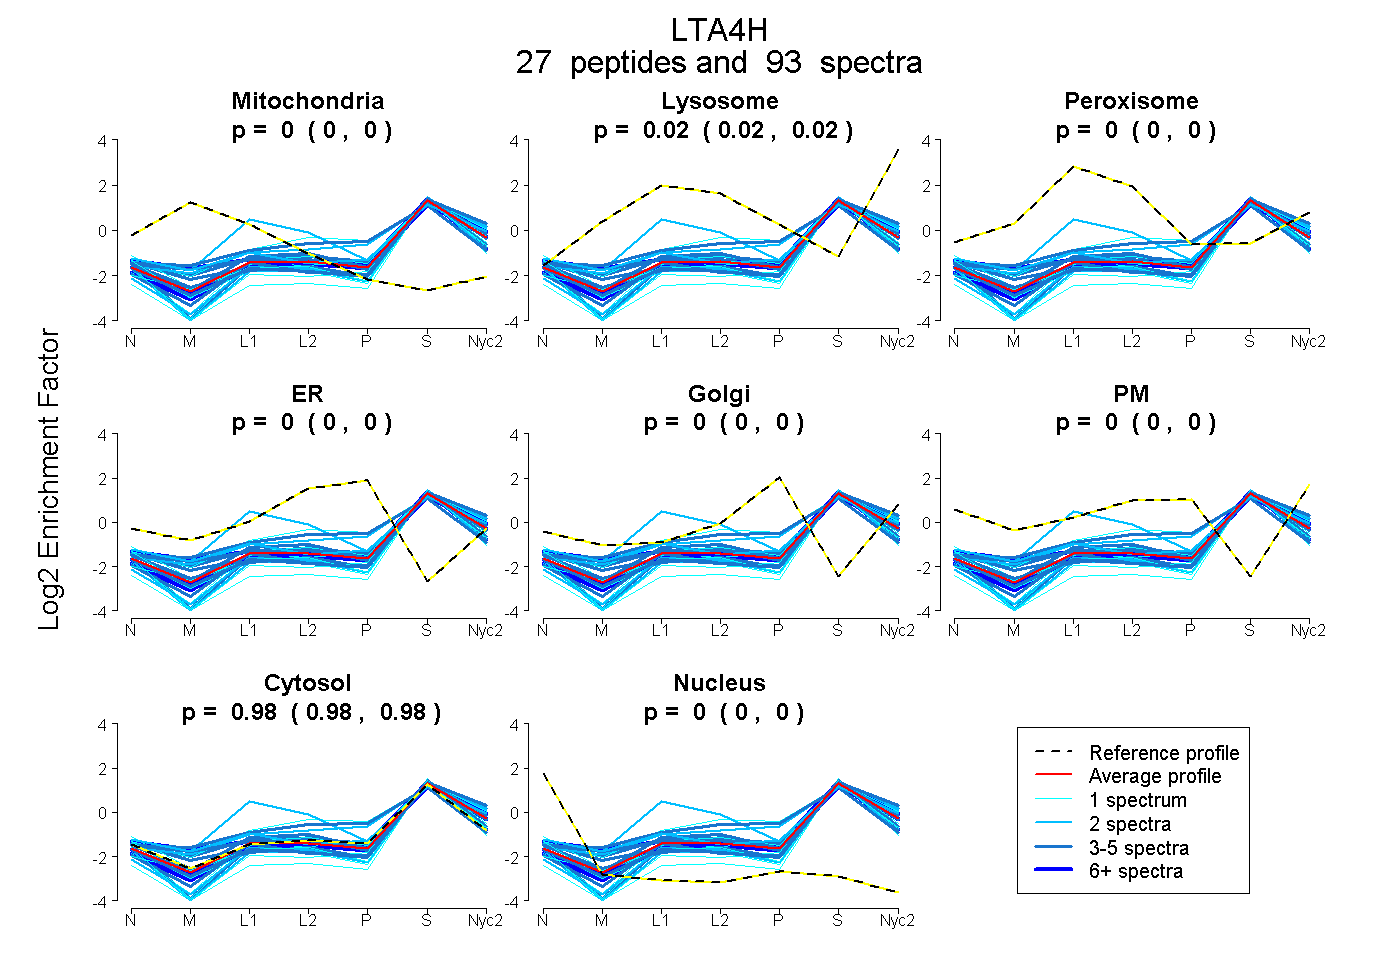
| Expt A |
27 peptides |
93 spectra |
|
0.000 0.000 | 0.000 |
0.019 0.016 | 0.021 |
0.000 0.000 | 0.000 |
0.000 0.000 | 0.000 |
0.000 0.000 | 0.000 |
0.000 0.000 | 0.000 |
0.981 0.978 | 0.983 |
0.000 0.000 | 0.000 |
| 5 spectra, SFLYAHFK | 0.000 | 0.000 | 0.000 | 0.000 | 0.000 | 0.000 | 1.000 | 0.000 | ||
| 2 spectra, VVINGQEVK | 0.023 | 0.118 | 0.000 | 0.000 | 0.000 | 0.000 | 0.859 | 0.000 | ||
| 5 spectra, TFGESHPFTK | 0.039 | 0.070 | 0.000 | 0.000 | 0.000 | 0.000 | 0.891 | 0.000 | ||
| 15 spectra, MATEQGR | 0.000 | 0.025 | 0.000 | 0.000 | 0.000 | 0.000 | 0.975 | 0.000 | ||
| 9 spectra, ACMHPVTAMLVGK | 0.000 | 0.000 | 0.000 | 0.000 | 0.000 | 0.000 | 1.000 | 0.000 | ||
| 1 spectrum, MPEVADTCSLASPASVCR | 0.000 | 0.014 | 0.000 | 0.000 | 0.000 | 0.000 | 0.986 | 0.000 | ||
| 1 spectrum, DVDPDVAYSSIPYEK | 0.000 | 0.000 | 0.000 | 0.000 | 0.000 | 0.000 | 1.000 | 0.000 | ||
| 4 spectra, TLVWSEK | 0.000 | 0.103 | 0.000 | 0.000 | 0.000 | 0.000 | 0.897 | 0.000 | ||
| 1 spectrum, SLTLDTK | 0.000 | 0.000 | 0.000 | 0.000 | 0.000 | 0.000 | 0.977 | 0.023 | ||
| 2 spectra, LVVDIK | 0.000 | 0.000 | 0.000 | 0.000 | 0.000 | 0.000 | 0.966 | 0.034 | ||
| 8 spectra, APLPLGHIK | 0.000 | 0.000 | 0.000 | 0.000 | 0.000 | 0.000 | 1.000 | 0.000 | ||
| 4 spectra, FTRPLFK | 0.000 | 0.091 | 0.000 | 0.000 | 0.000 | 0.000 | 0.909 | 0.000 | ||
| 1 spectrum, FSYQSVTTDDWK | 0.000 | 0.209 | 0.000 | 0.011 | 0.025 | 0.000 | 0.755 | 0.000 | ||
| 3 spectra, QHPYLFSQCQAIHCR | 0.000 | 0.000 | 0.105 | 0.111 | 0.000 | 0.000 | 0.784 | 0.000 | ||
| 3 spectra, AILPCQDTPSVK | 0.000 | 0.000 | 0.000 | 0.000 | 0.000 | 0.000 | 0.969 | 0.031 | ||
| 4 spectra, ELVALMSAIR | 0.000 | 0.125 | 0.000 | 0.000 | 0.000 | 0.000 | 0.875 | 0.000 | ||
| 5 spectra, YTLGESQGYK | 0.000 | 0.000 | 0.000 | 0.000 | 0.000 | 0.000 | 1.000 | 0.000 | ||
| 2 spectra, LCIQSK | 0.000 | 0.165 | 0.000 | 0.000 | 0.028 | 0.000 | 0.807 | 0.000 | ||
| 1 spectrum, DLTIEK | 0.000 | 0.000 | 0.000 | 0.000 | 0.000 | 0.000 | 0.998 | 0.002 | ||
| 1 spectrum, TYQEHK | 0.000 | 0.000 | 0.000 | 0.000 | 0.000 | 0.000 | 1.000 | 0.000 | ||
| 2 spectra, HFHALGGWGELQNTIK | 0.000 | 0.053 | 0.313 | 0.000 | 0.000 | 0.000 | 0.634 | 0.000 | ||
| 2 spectra, SAYEFSETESMLK | 0.000 | 0.000 | 0.000 | 0.000 | 0.000 | 0.000 | 1.000 | 0.000 | ||
| 1 spectrum, GSPMEISLPIALSK | 0.000 | 0.000 | 0.000 | 0.000 | 0.000 | 0.000 | 0.948 | 0.052 | ||
| 3 spectra, MQEVYNFNAINNSEIR | 0.000 | 0.000 | 0.000 | 0.000 | 0.000 | 0.000 | 1.000 | 0.000 | ||
| 1 spectrum, WEEAIPLALK | 0.000 | 0.000 | 0.000 | 0.000 | 0.000 | 0.000 | 1.000 | 0.000 | ||
| 1 spectrum, EEDLNSFSIEDLK | 0.000 | 0.000 | 0.000 | 0.000 | 0.000 | 0.000 | 0.956 | 0.044 | ||
| 6 spectra, DLAAFDK | 0.064 | 0.056 | 0.000 | 0.000 | 0.000 | 0.000 | 0.880 | 0.000 |
| Plot | Mito | Lyso or Perox | ER | Golgi | PM | Cytosol | Nucleus | ||||||
| Expt B |
13 peptides |
21 spectra |
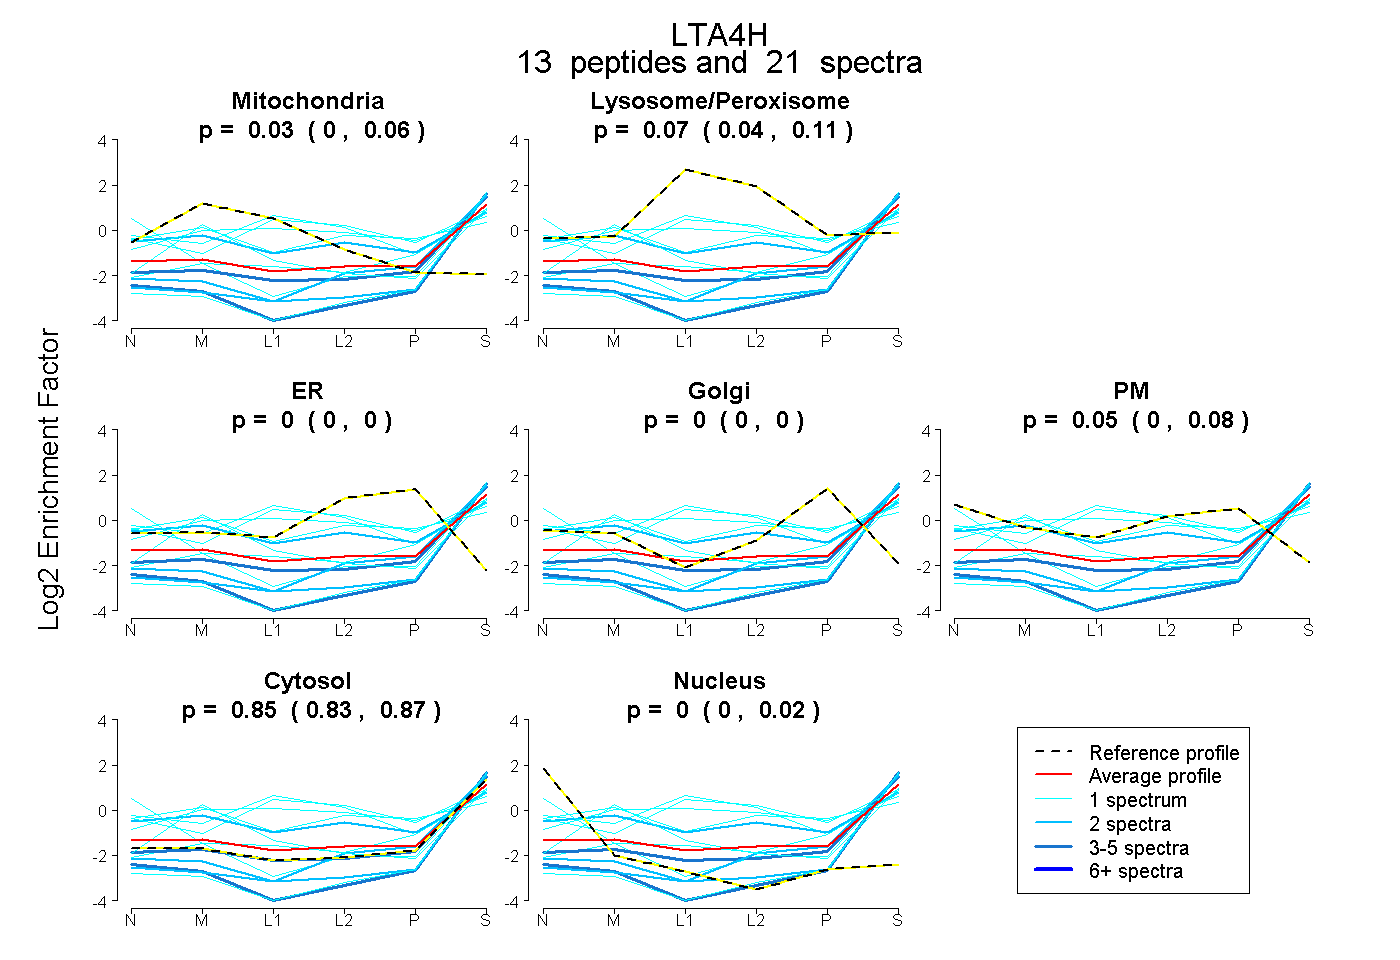 |
0.029 0.000 | 0.061 |
0.072 0.038 | 0.107 |
0.000 0.000 | 0.000 |
0.000 0.000 | 0.000 |
0.045 0.000 | 0.079 |
0.854 0.829 | 0.873 |
0.000 0.000 | 0.021 |
|||
| Plot | Lyso | Other | |||||||||||
| Expt C |
19 peptides |
53 spectra |
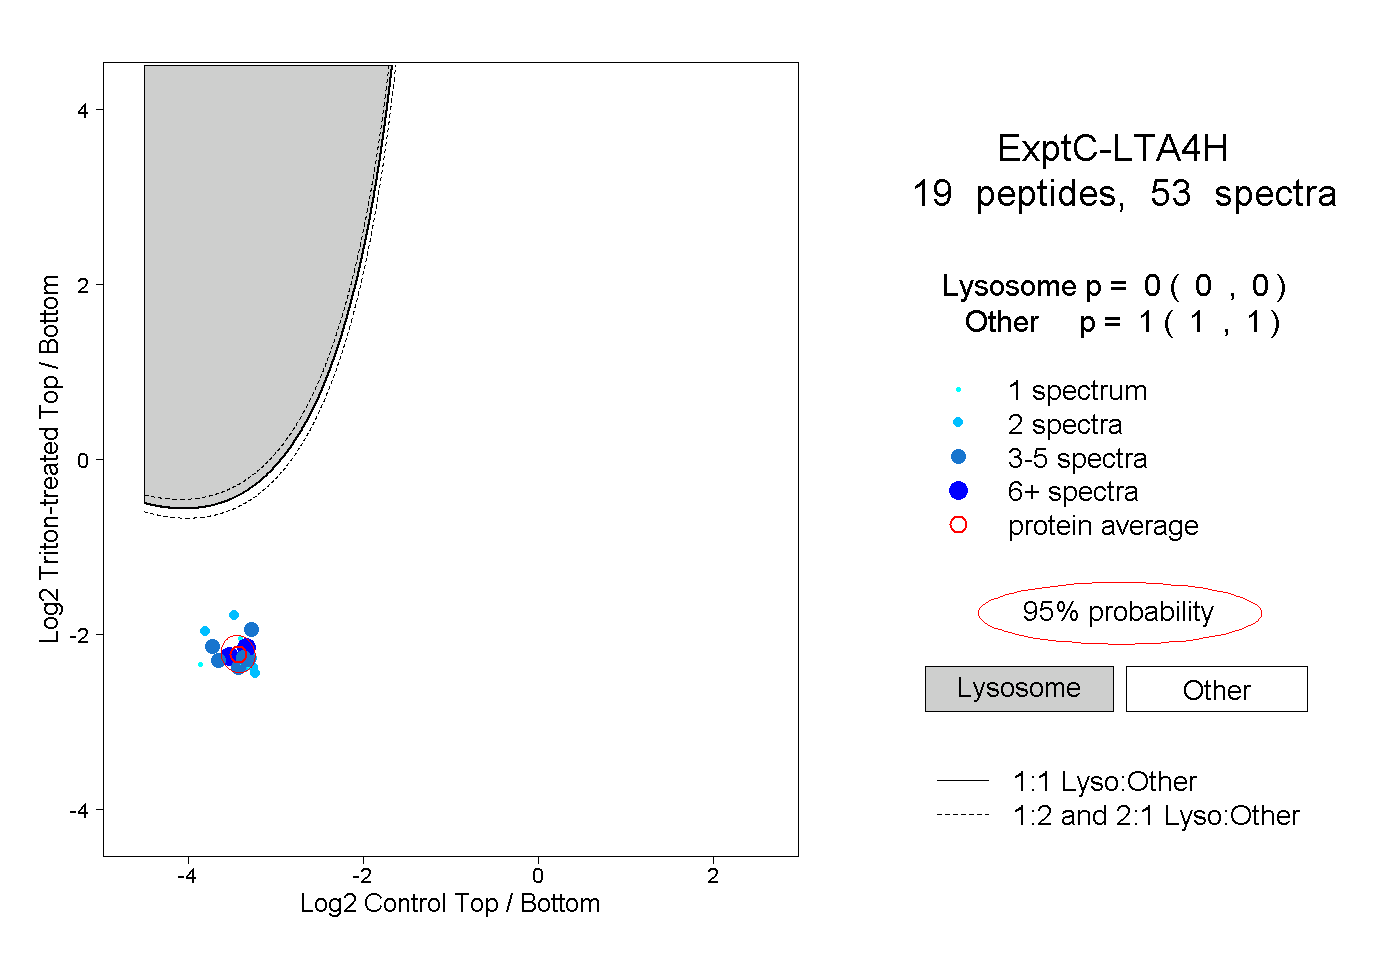 |
0.000 0.000 | 0.000 |
1.000 1.000 | 1.000 |
||||||||
| Plot | Lyso | Other | |||||||||||
| Expt D |
5 peptides |
7 spectra |
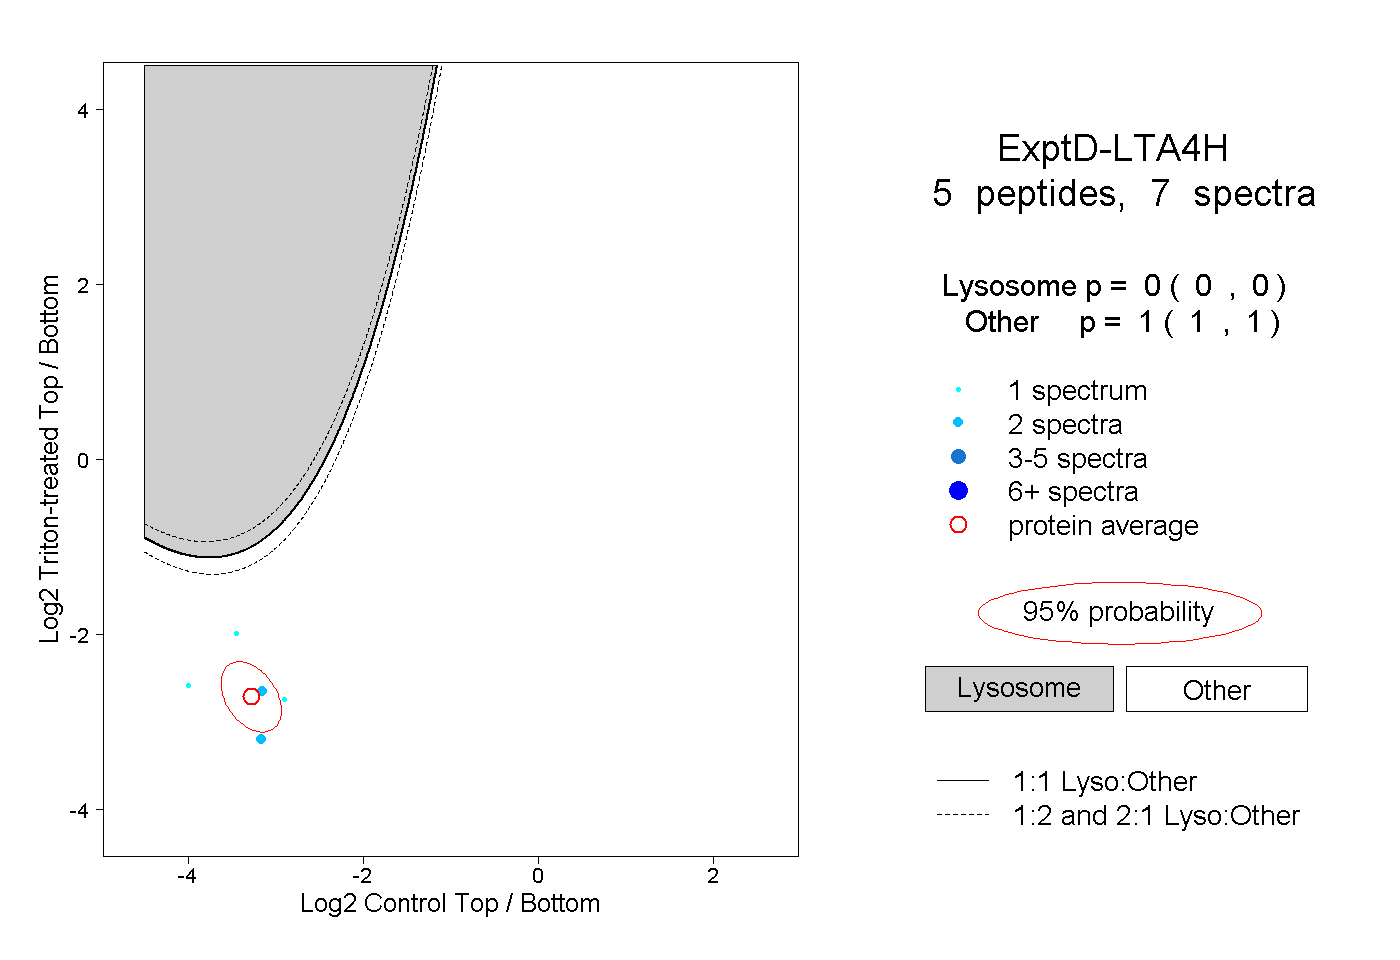 |
0.000 0.000 | 0.000 |
1.000 1.000 | 1.000 |