 5
5peptides
spectra
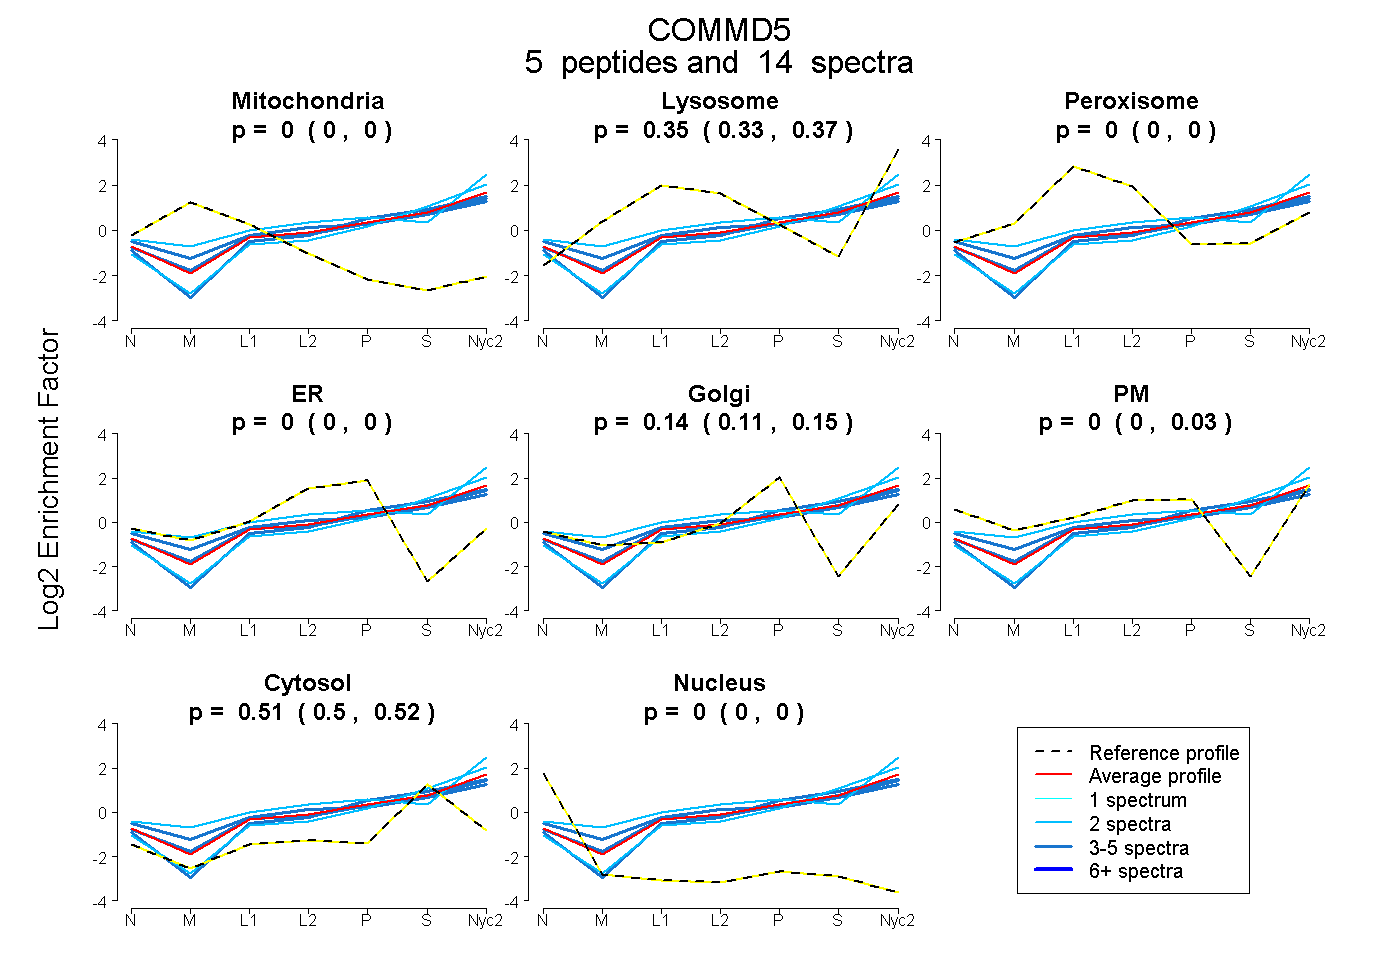
0.000 | 0.000
0.327 | 0.365
0.000 | 0.000
0.000 | 0.000
0.114 | 0.150
0.000 | 0.028
0.496 | 0.524
0.000 | 0.000
2peptides
spectra
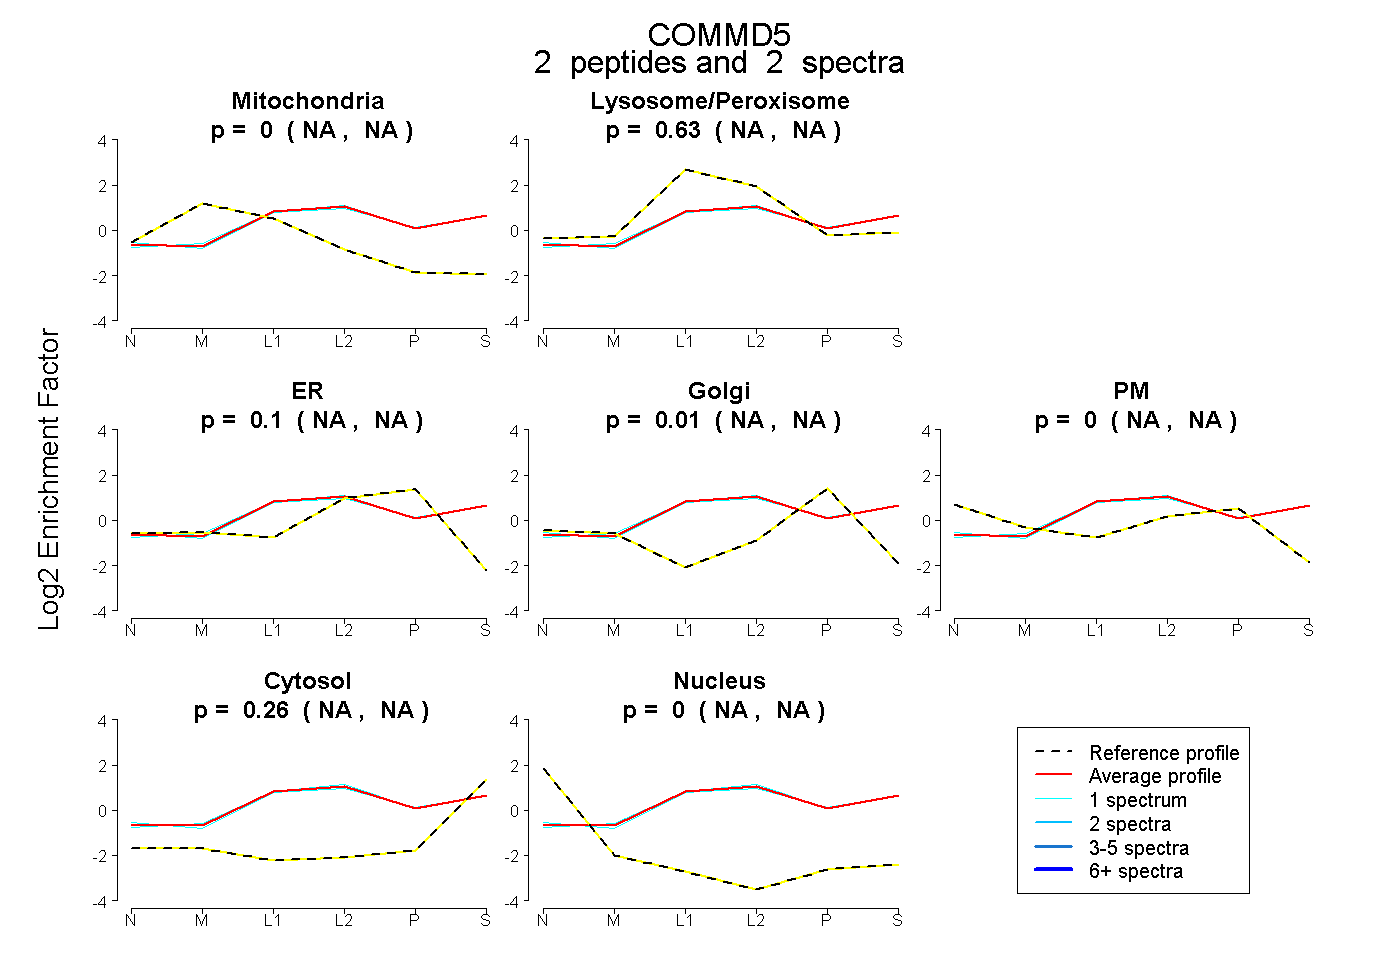
NA | NA
NA | NA
NA | NA
NA | NA
NA | NA
NA | NA
NA | NA
7peptides
spectra
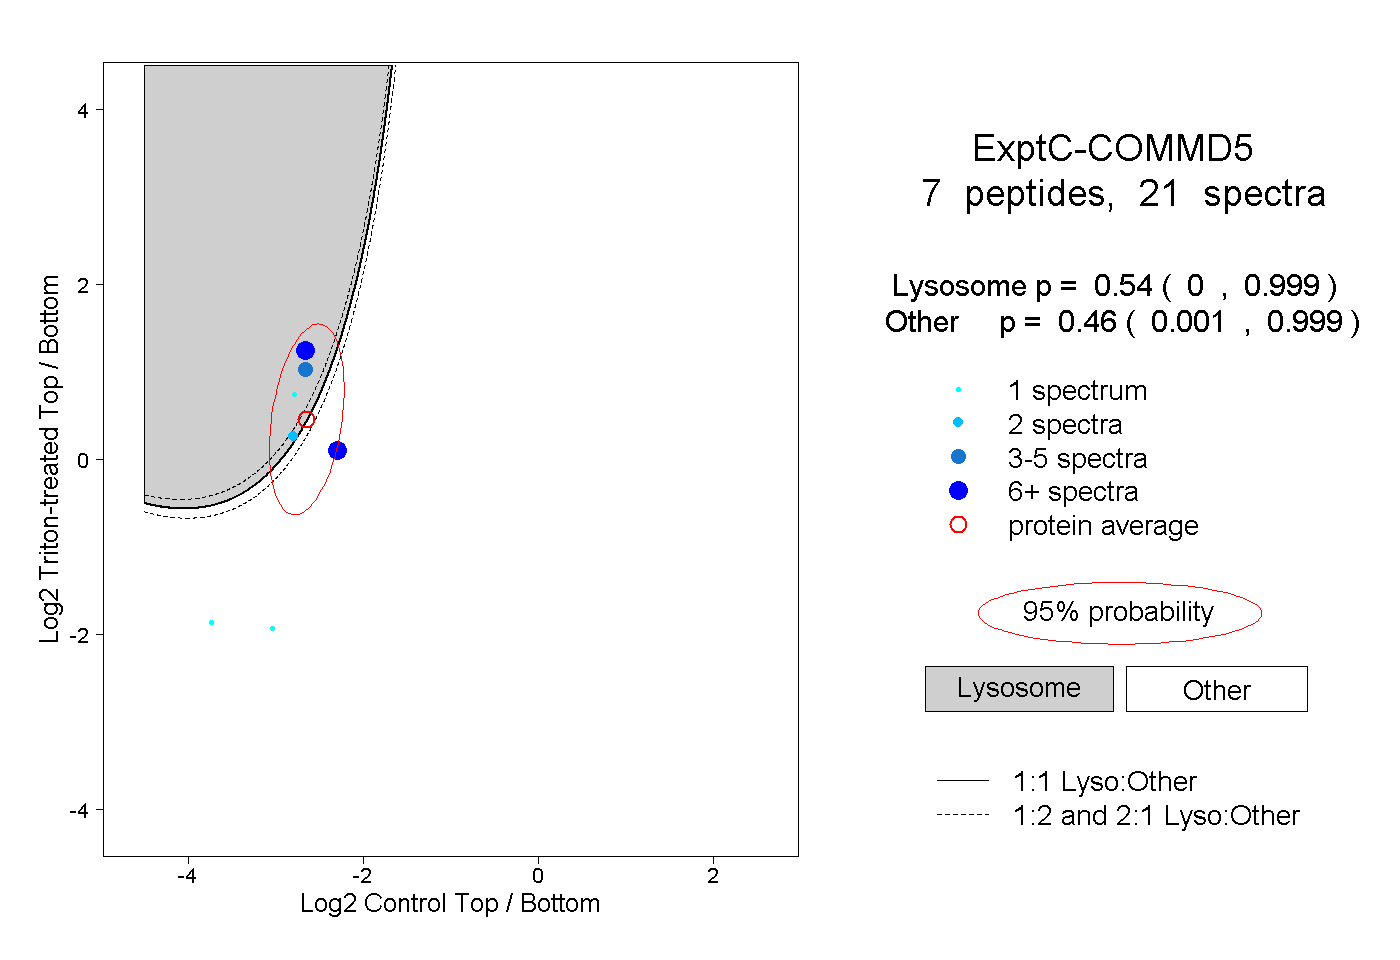
0.000 | 0.999
0.001 | 0.999
1peptide
spectra
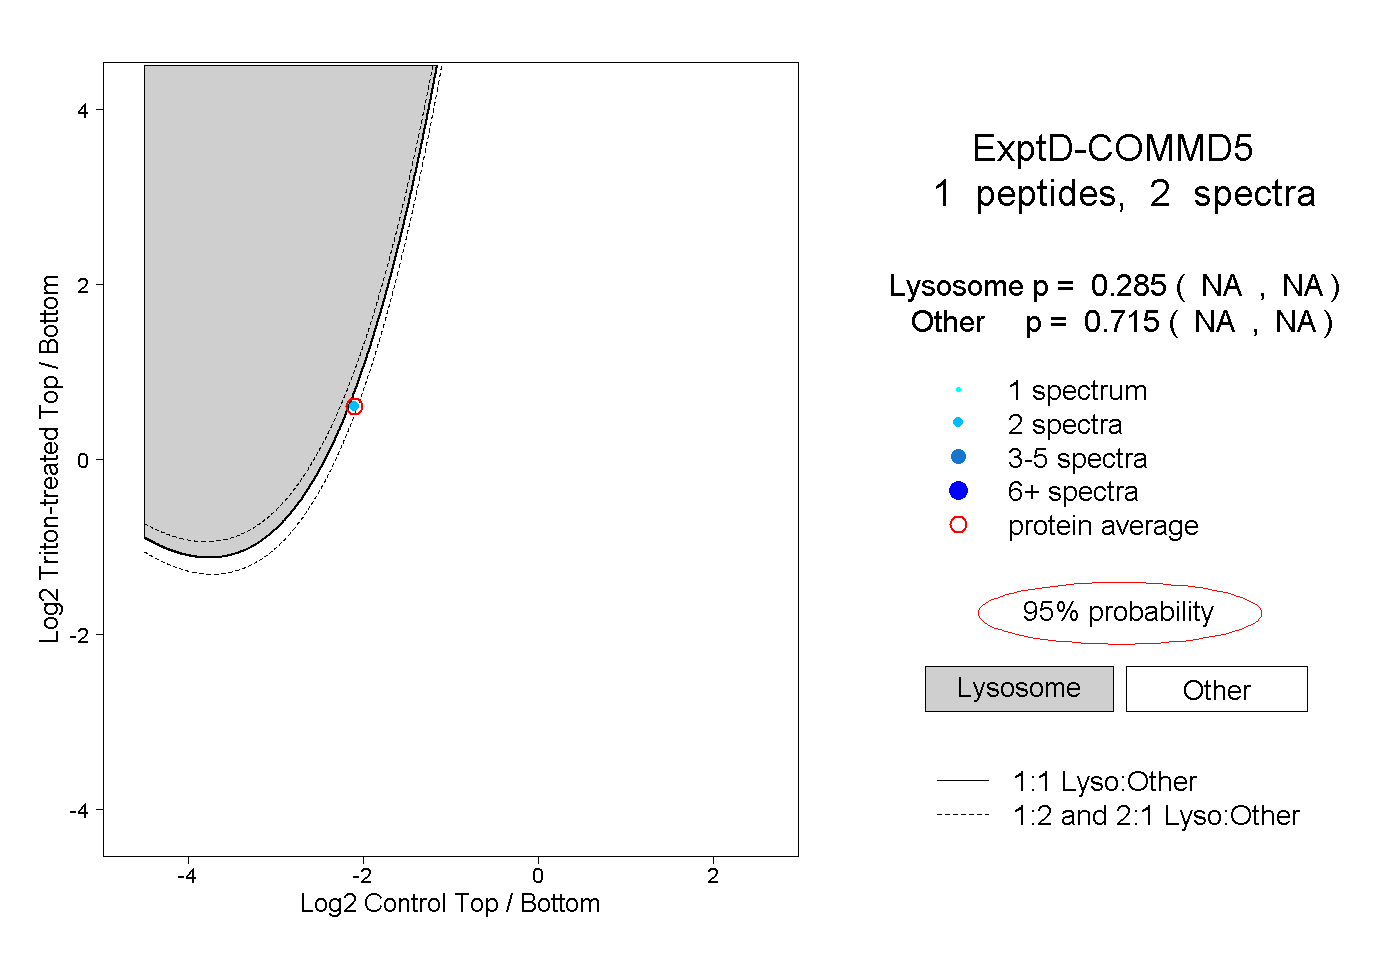
NA | NA
NA | NA