 8
8peptides
spectra
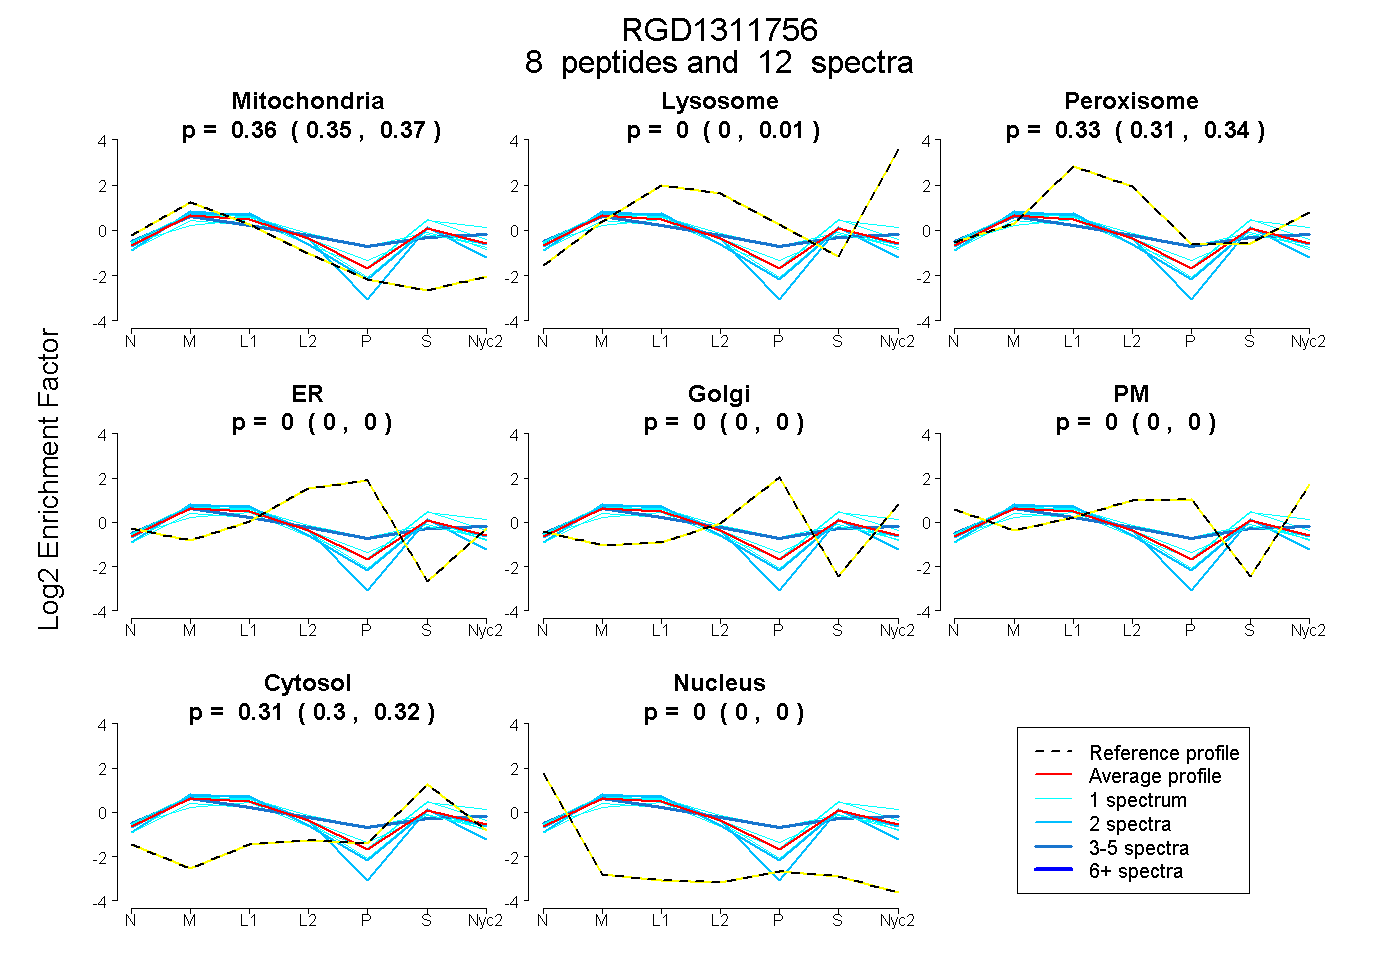
0.346 | 0.374
0.000 | 0.014
0.310 | 0.336
0.000 | 0.000
0.000 | 0.000
0.000 | 0.000
0.305 | 0.320
0.000 | 0.000
1peptide
spectrum
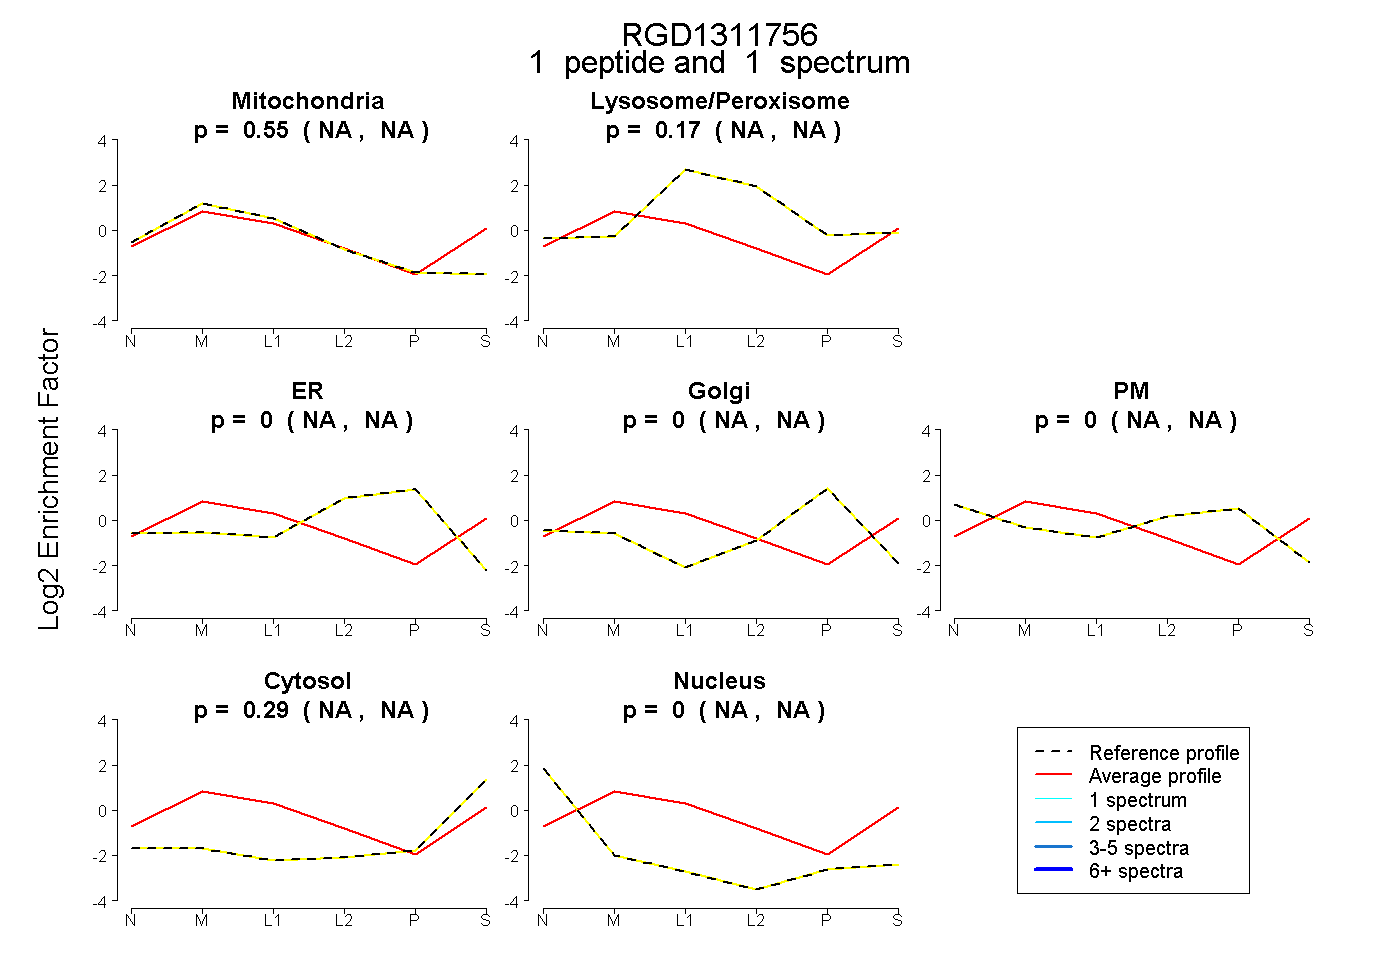
NA | NA
NA | NA
NA | NA
NA | NA
NA | NA
NA | NA
NA | NA
13peptides
spectra
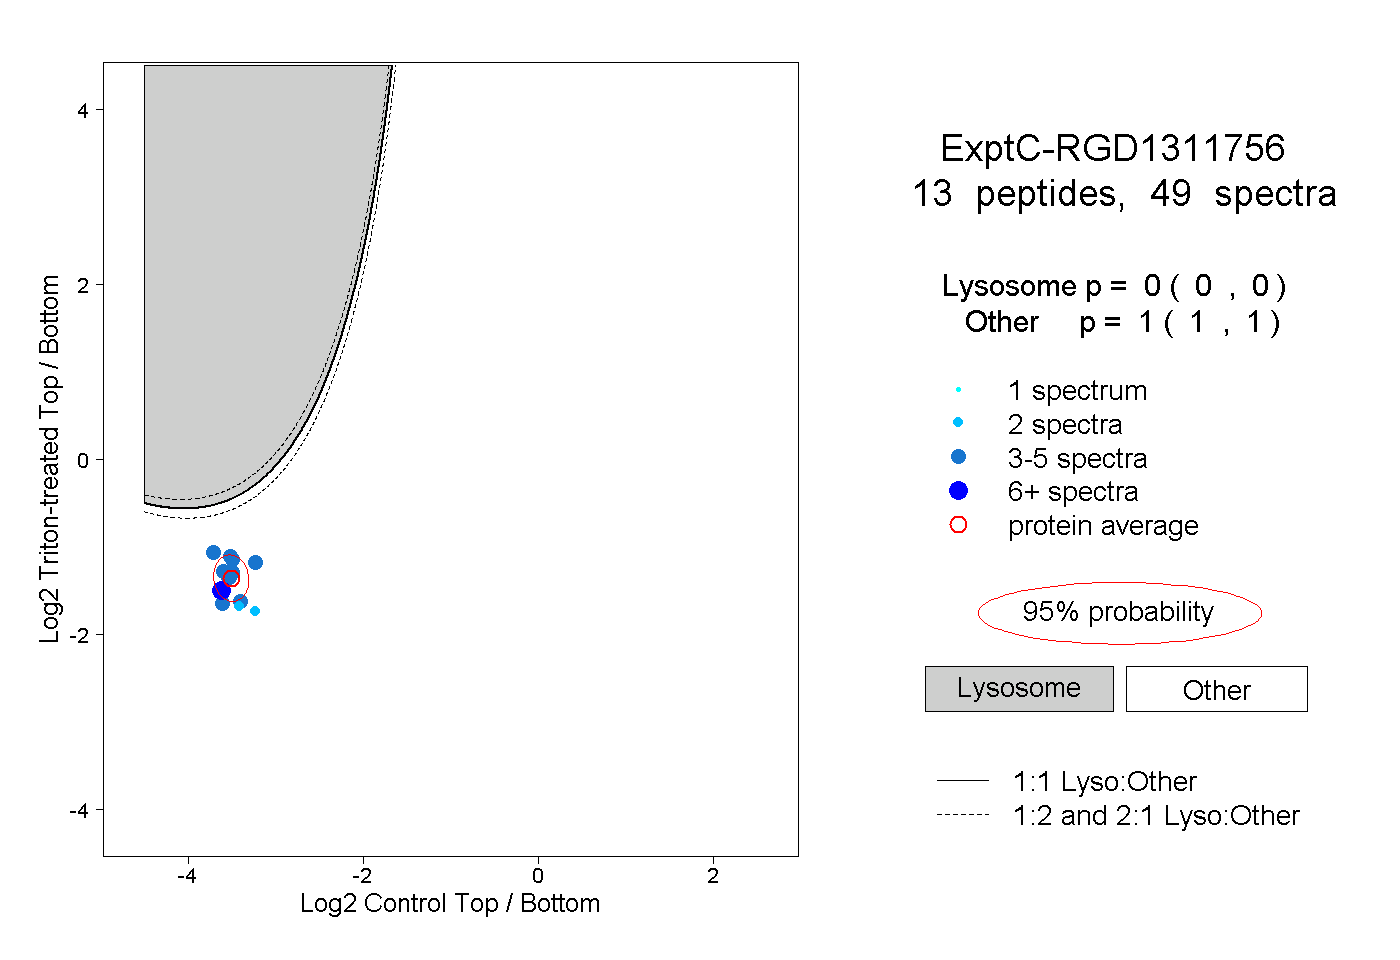
0.000 | 0.000
1.000 | 1.000
4peptides
spectra
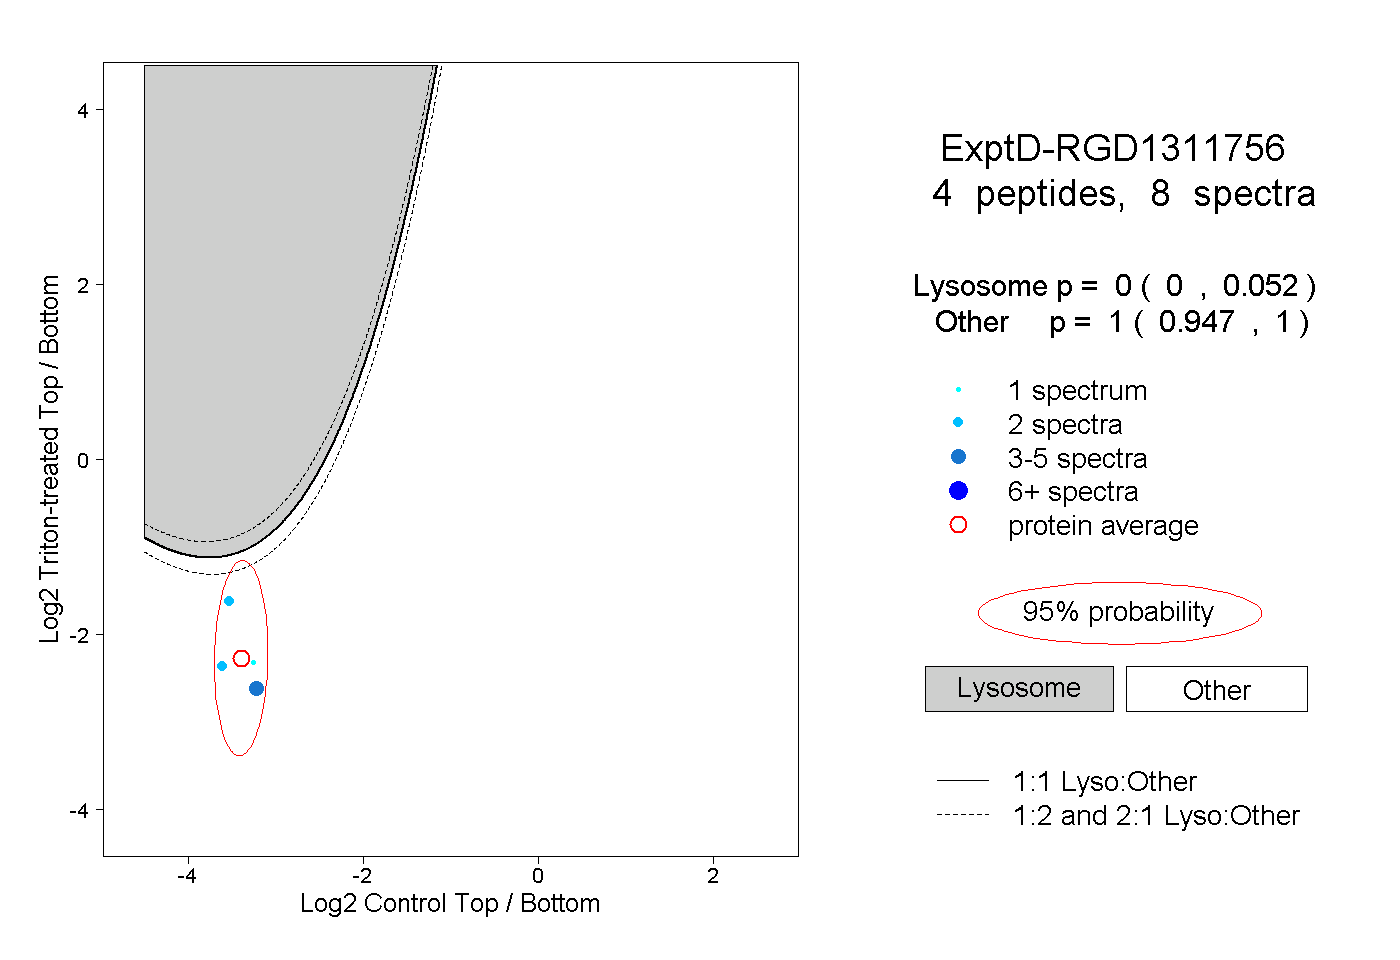
0.000 | 0.052
0.947 | 1.000