 8
8peptides
spectra
0.346 | 0.374
0.000 | 0.014
0.310 | 0.336
0.000 | 0.000
0.000 | 0.000
0.000 | 0.000
0.305 | 0.320
0.000 | 0.000
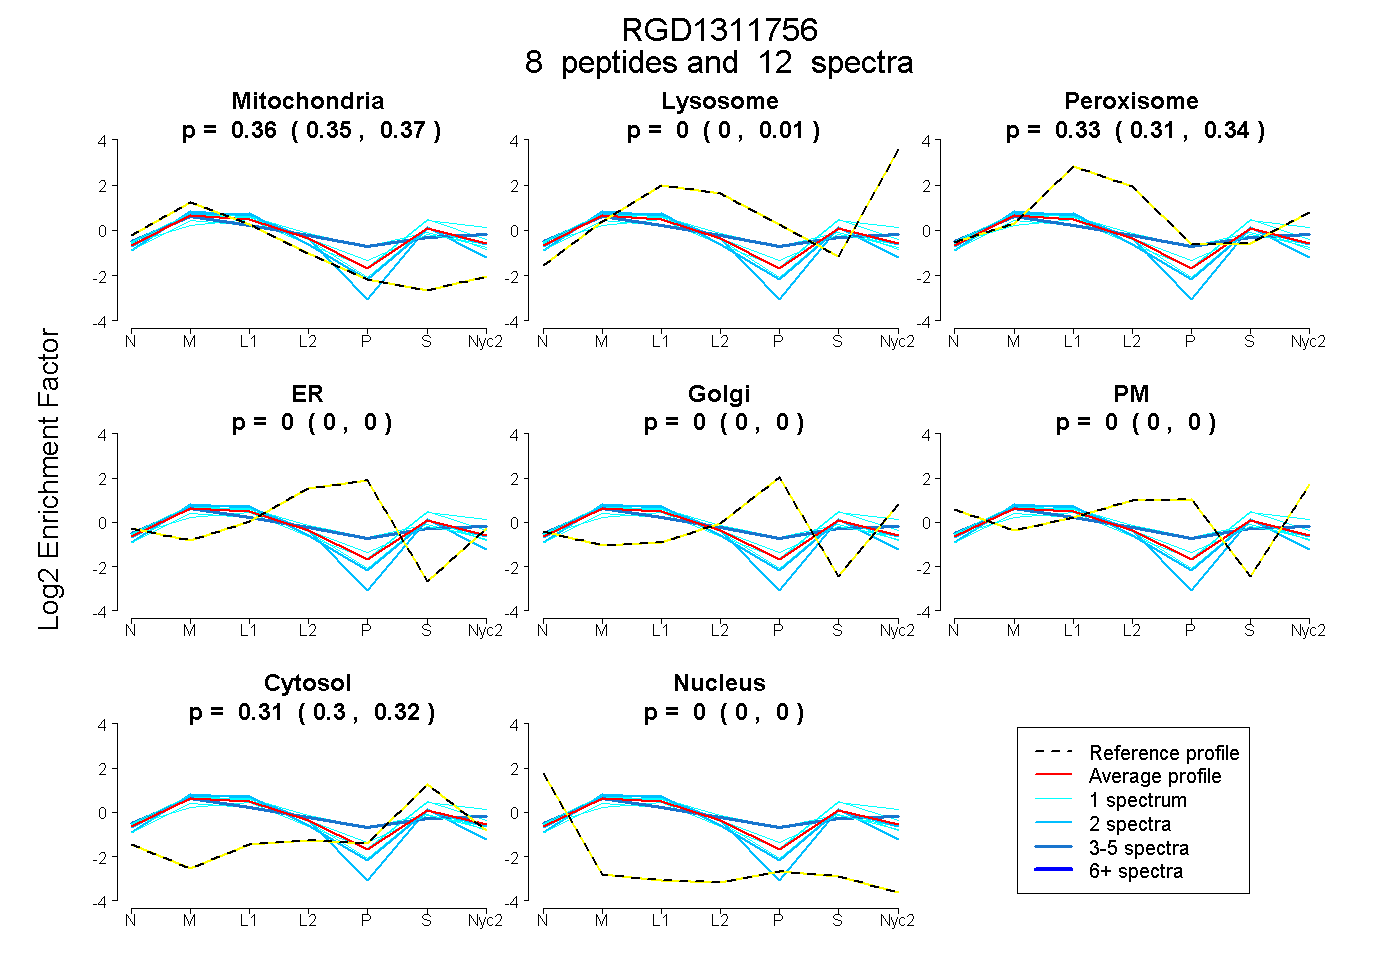
| Plot | Mito | Lyso | Perox | ER | Golgi | PM | Cytosol | Nucleus | |||||
| Expt A |
8 peptides |
12 spectra |
|
0.360 0.346 | 0.374 |
0.000 0.000 | 0.014 |
0.327 0.310 | 0.336 |
0.000 0.000 | 0.000 |
0.000 0.000 | 0.000 |
0.000 0.000 | 0.000 |
0.313 0.305 | 0.320 |
0.000 0.000 | 0.000 |
| 1 spectrum, TFPQLSAVPDIR | 0.398 | 0.017 | 0.313 | 0.000 | 0.000 | 0.000 | 0.272 | 0.000 | ||
| 1 spectrum, GGSVEDAR | 0.327 | 0.000 | 0.383 | 0.000 | 0.021 | 0.000 | 0.269 | 0.000 | ||
| 1 spectrum, TICPQFQK | 0.400 | 0.000 | 0.293 | 0.000 | 0.000 | 0.000 | 0.306 | 0.000 | ||
| 1 spectrum, IVEDAVK | 0.263 | 0.000 | 0.325 | 0.000 | 0.000 | 0.000 | 0.412 | 0.000 | ||
| 1 spectrum, GIGHLLLK | 0.255 | 0.154 | 0.196 | 0.000 | 0.000 | 0.000 | 0.396 | 0.000 | ||
| 2 spectra, FDHLVAVER | 0.496 | 0.000 | 0.223 | 0.000 | 0.000 | 0.000 | 0.281 | 0.000 | ||
| 3 spectra, MLGILVQNQVR | 0.341 | 0.144 | 0.192 | 0.000 | 0.044 | 0.012 | 0.268 | 0.000 | ||
| 2 spectra, TPIPILTYR | 0.405 | 0.000 | 0.301 | 0.000 | 0.000 | 0.000 | 0.294 | 0.000 |
| Plot | Mito | Lyso or Perox | ER | Golgi | PM | Cytosol | Nucleus | ||||||
| Expt B |
1 peptide |
1 spectrum |
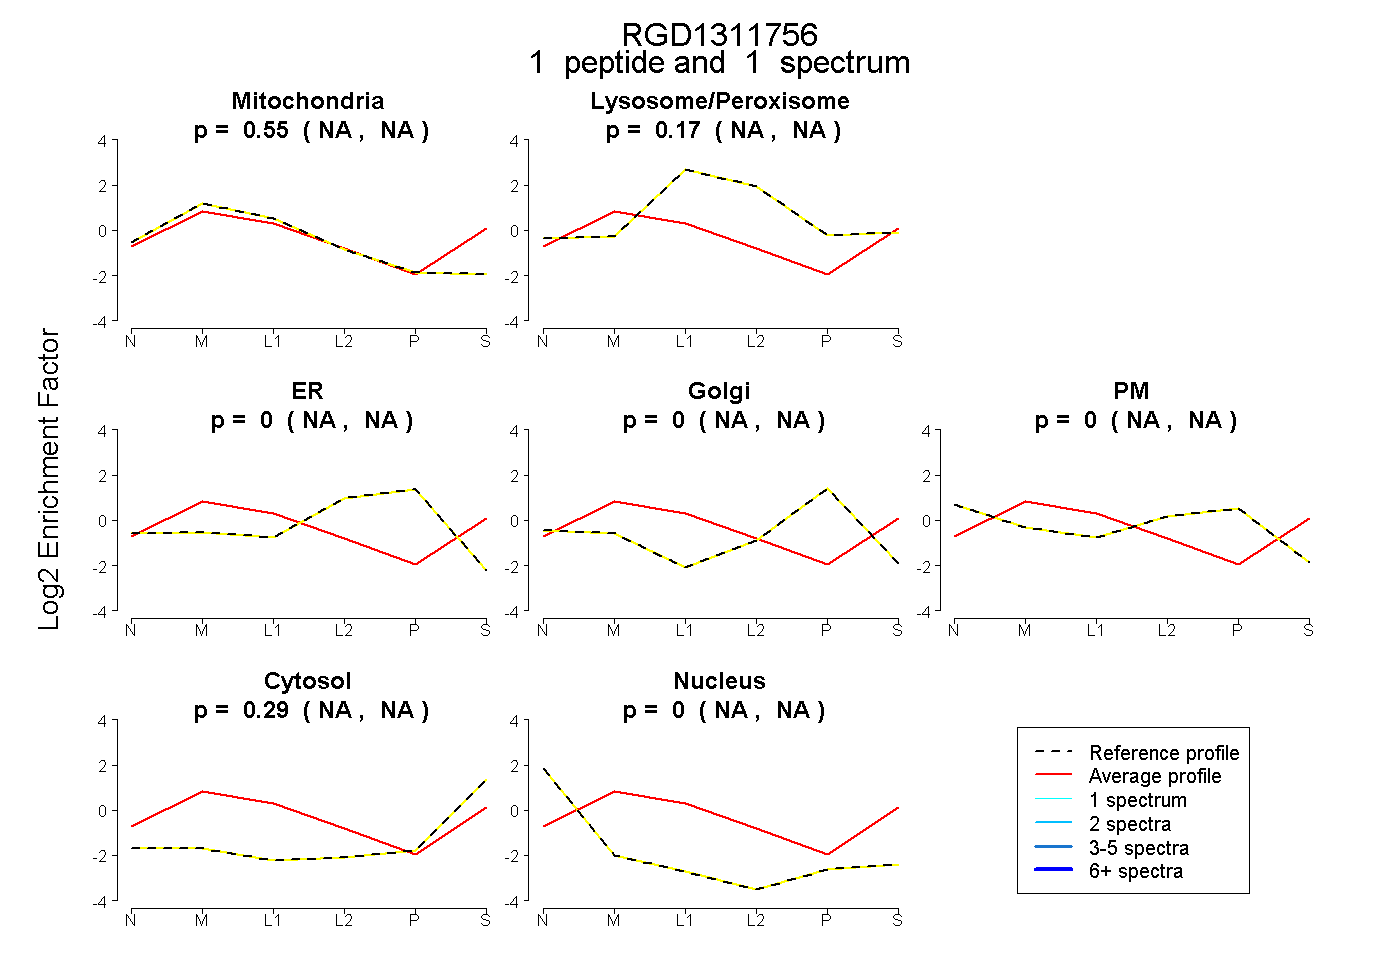 |
0.547 NA | NA |
0.166 NA | NA |
0.000 NA | NA |
0.000 NA | NA |
0.000 NA | NA |
0.287 NA | NA |
0.000 NA | NA |
|||
| Plot | Lyso | Other | |||||||||||
| Expt C |
13 peptides |
49 spectra |
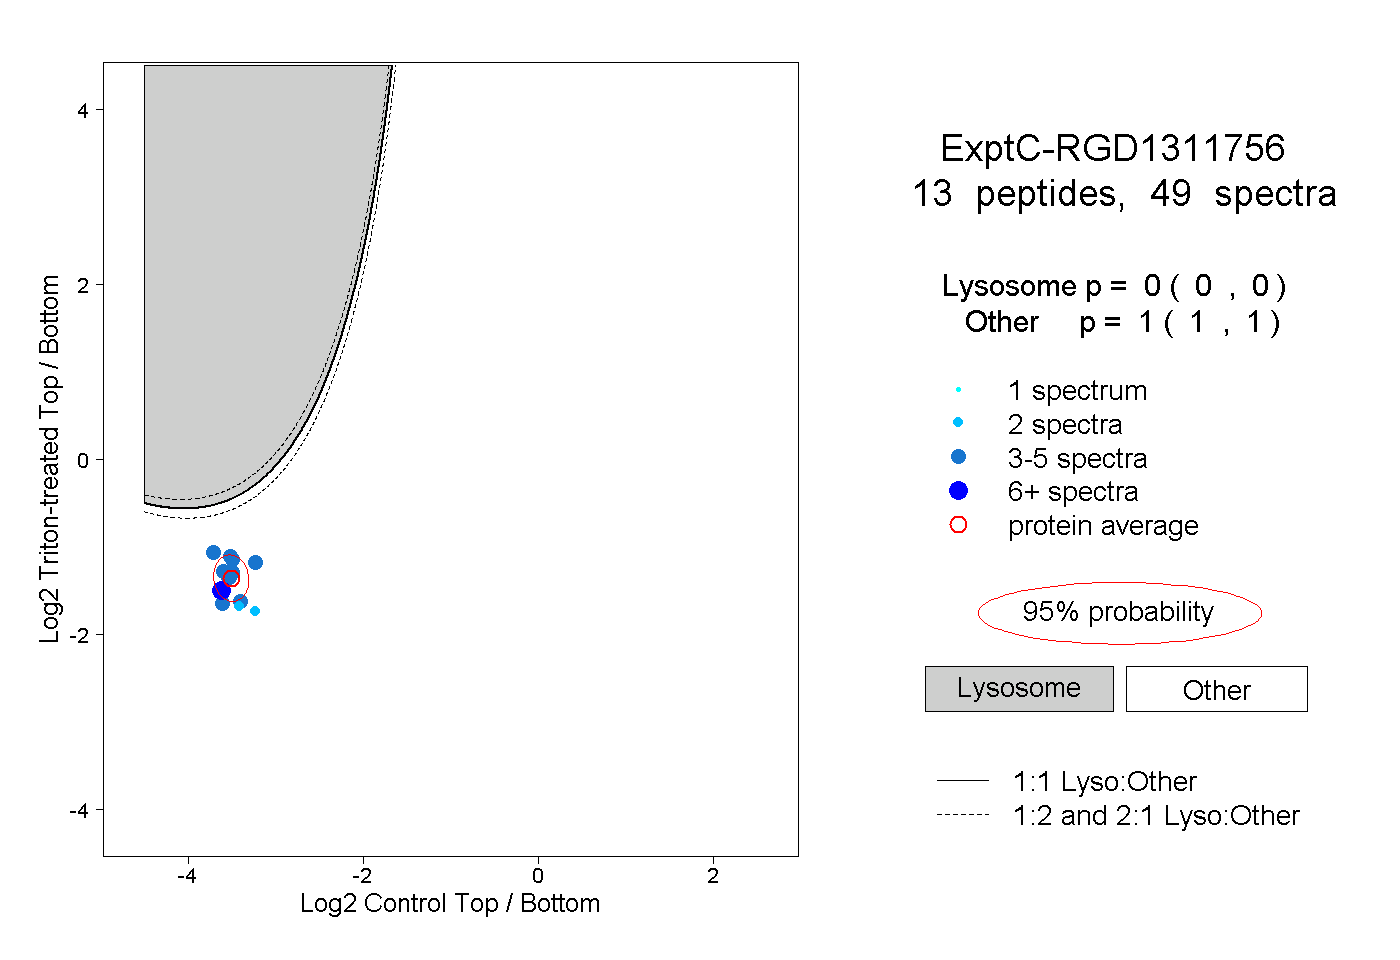 |
0.000 0.000 | 0.000 |
1.000 1.000 | 1.000 |
||||||||
| Plot | Lyso | Other | |||||||||||
| Expt D |
4 peptides |
8 spectra |
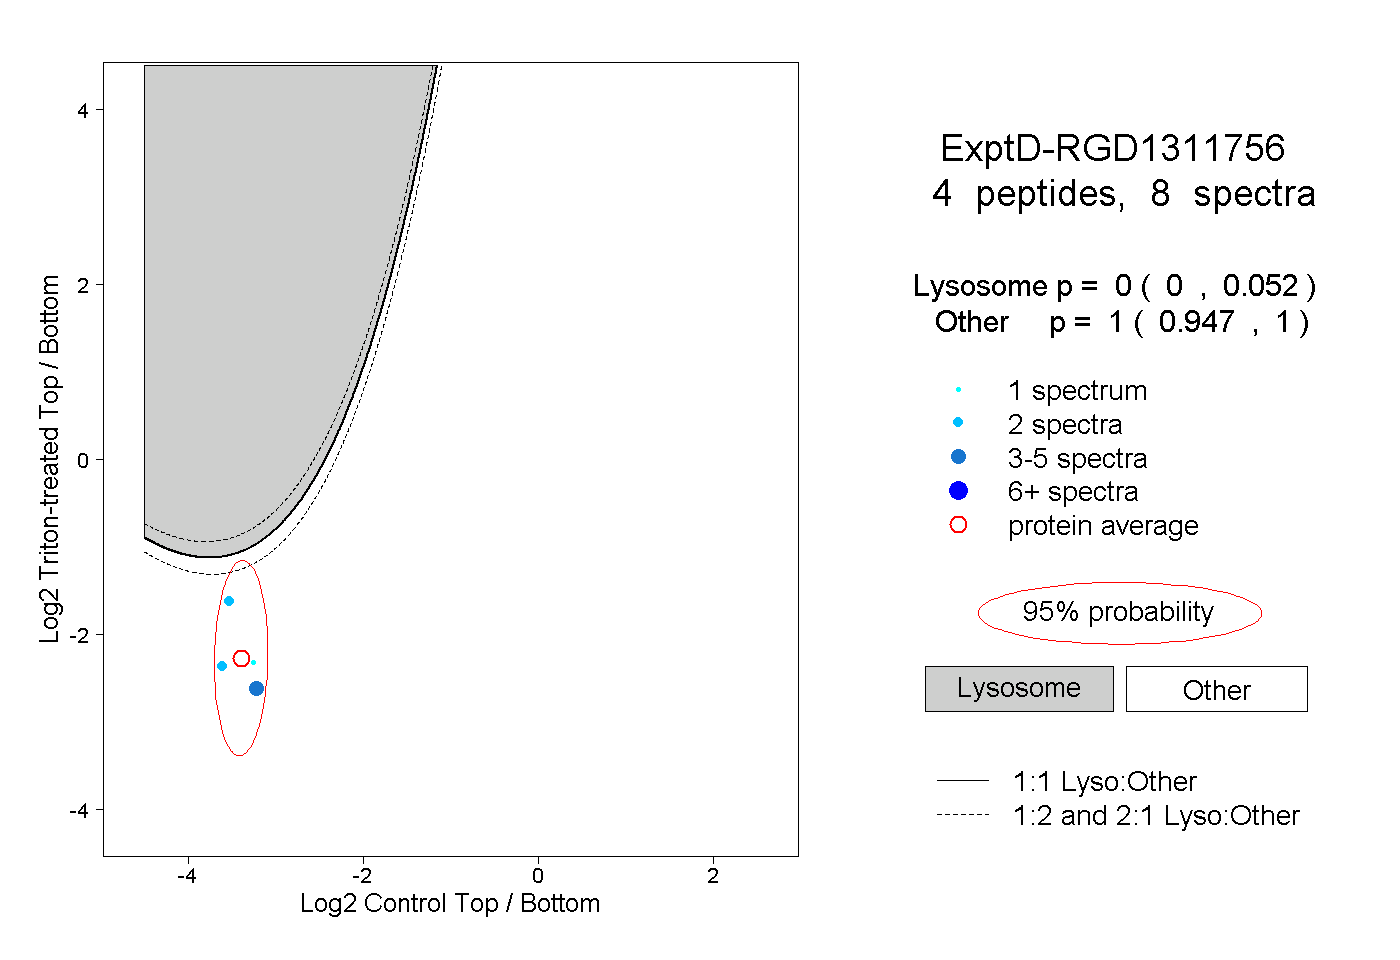 |
0.000 0.000 | 0.052 |
1.000 0.947 | 1.000 |