 1
1peptide
spectra
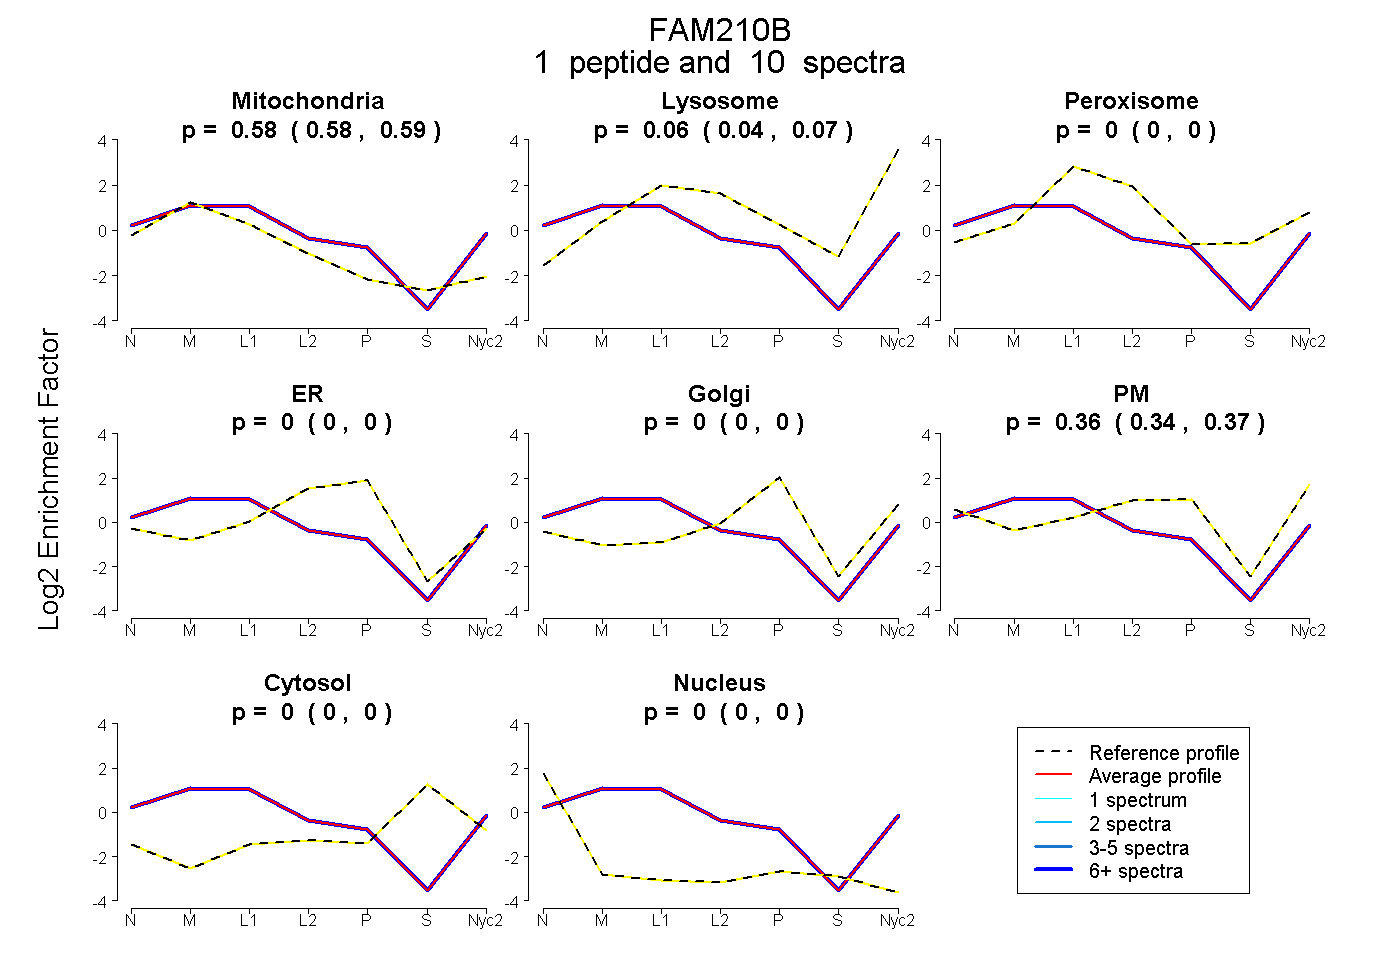
0.578 | 0.588
0.043 | 0.070
0.000 | 0.000
0.000 | 0.000
0.000 | 0.000
0.344 | 0.373
0.000 | 0.000
0.000 | 0.000
2peptides
spectra
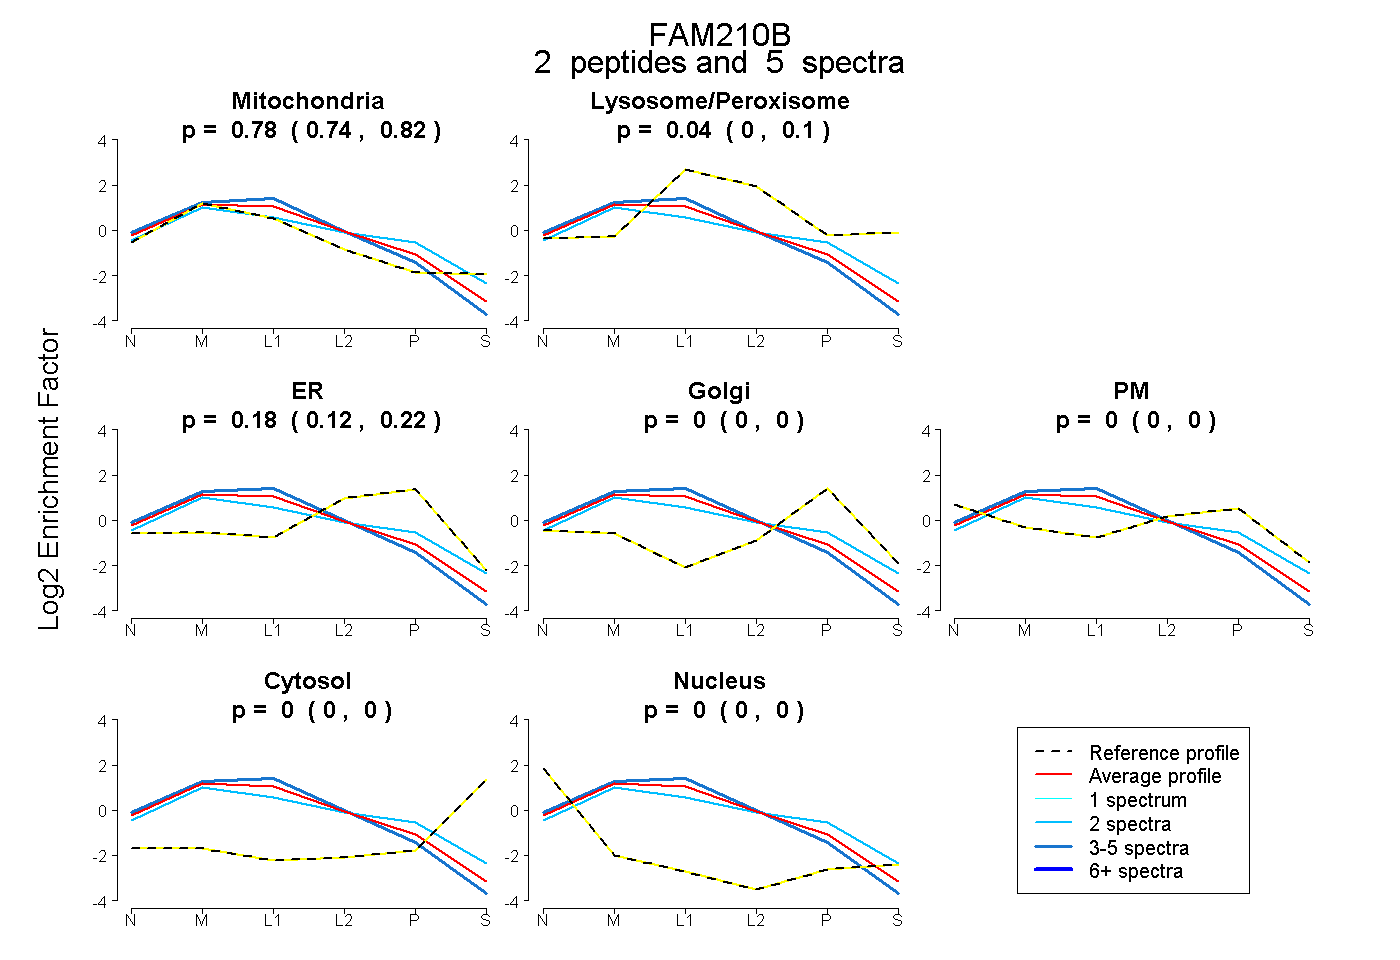
0.738 | 0.820
0.000 | 0.104
0.117 | 0.221
0.000 | 0.000
0.000 | 0.000
0.000 | 0.000
0.000 | 0.000
7peptides
spectra
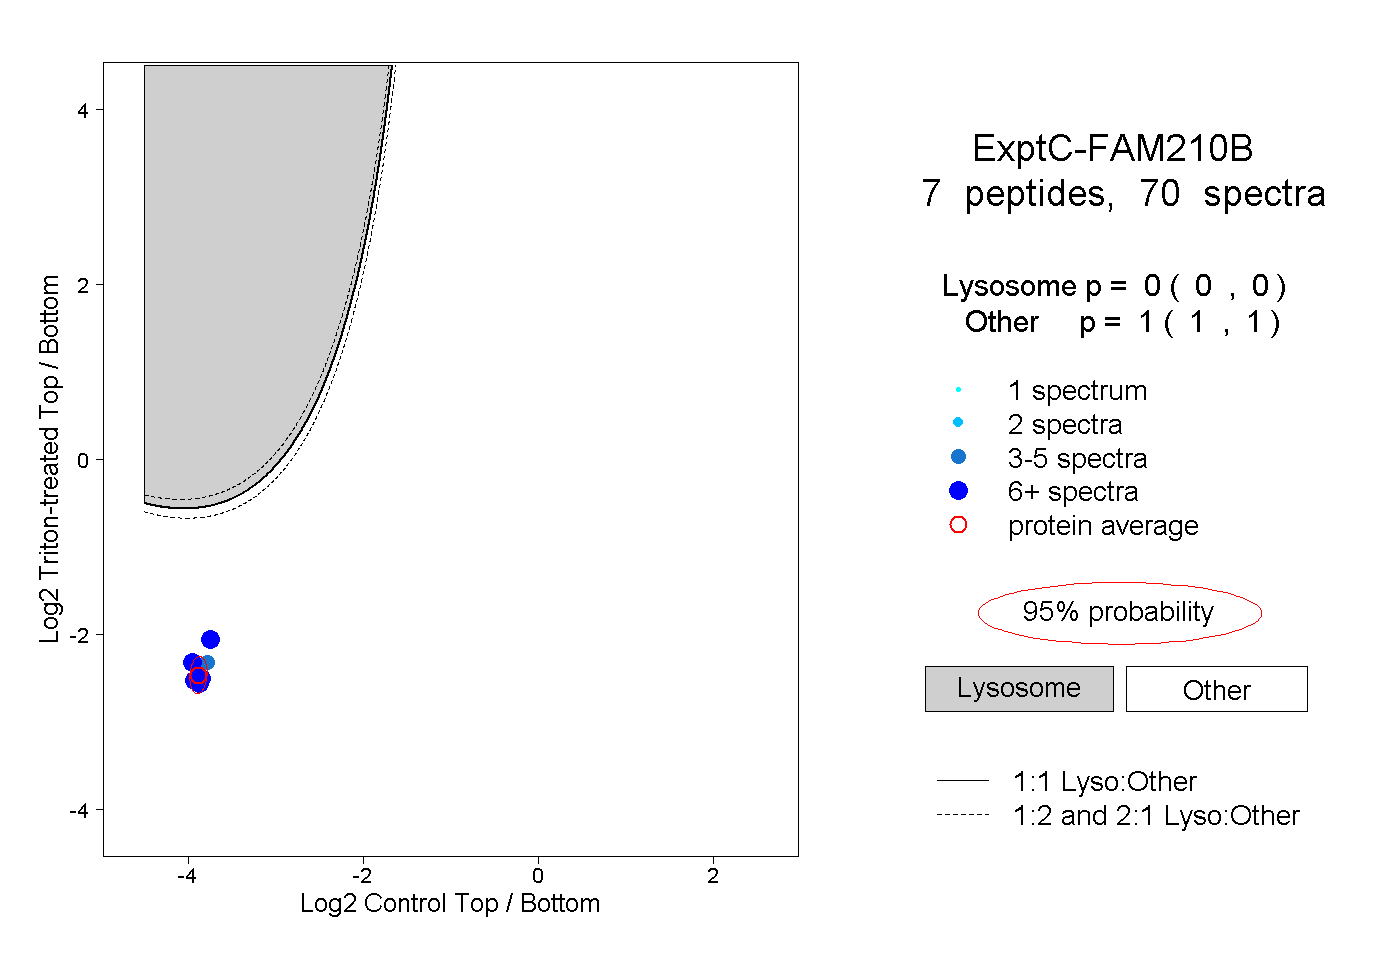
0.000 | 0.000
1.000 | 1.000
1peptide
spectra
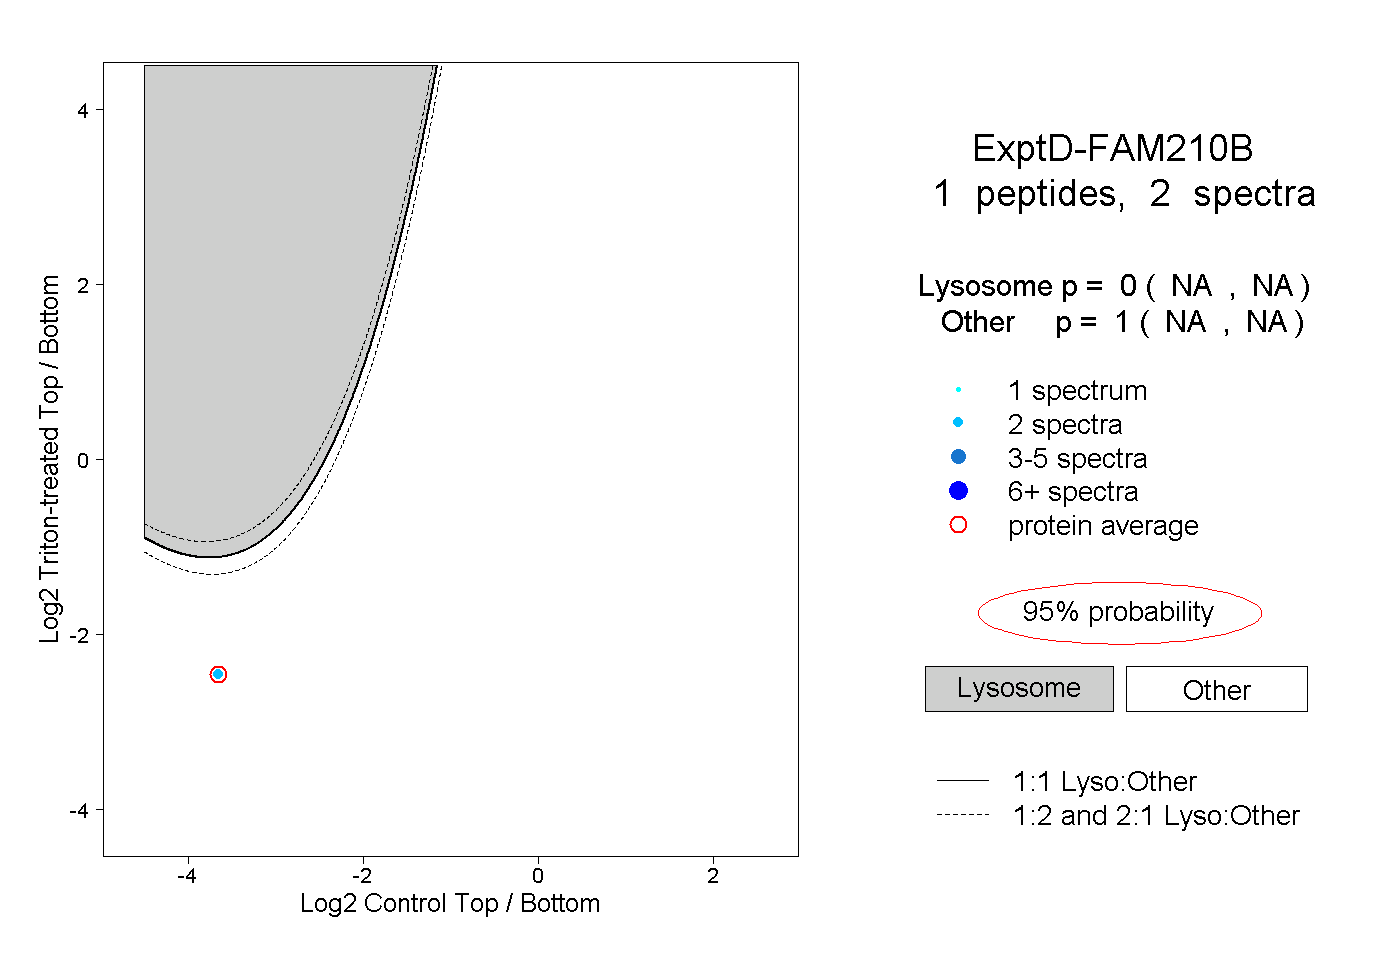
NA | NA
NA | NA