FAM210B
[ENSRNOP00000005901]
Main page
| | | Plot |
Mito |
Lyso |
|
Perox |
ER |
Golgi |
PM |
Cytosol |
Nucleus |
|
| Expt A |
 1
1
peptide |
10
spectra |
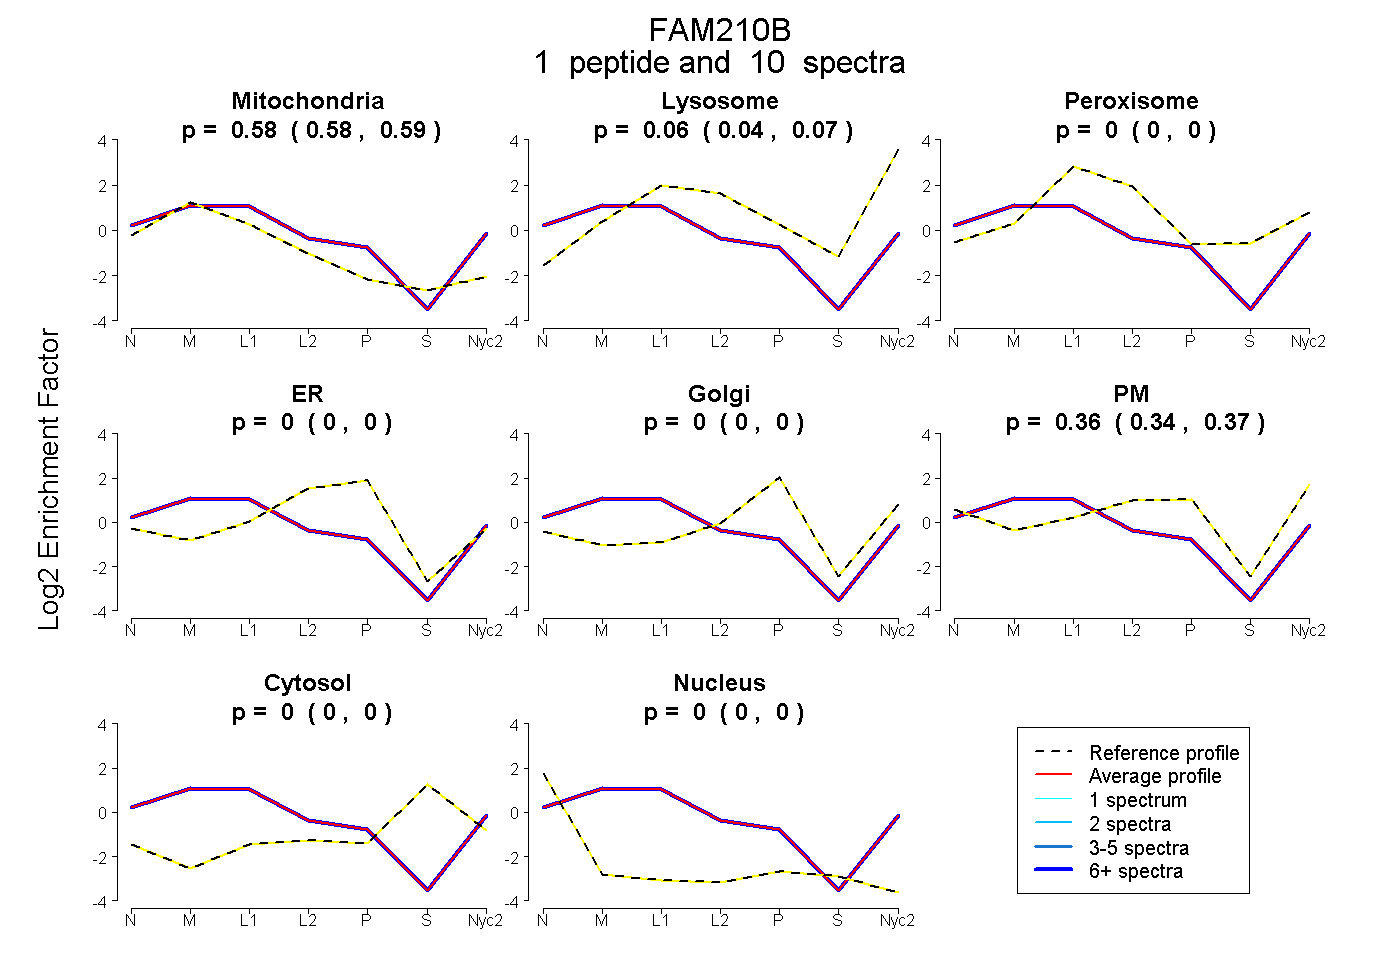 |
0.584
0.578 | 0.588 |
0.057
0.043 | 0.070 |
|
0.000
0.000 | 0.000 |
0.000
0.000 | 0.000 |
0.000
0.000 | 0.000 |
0.359
0.344 | 0.373 |
0.000
0.000 | 0.000 |
0.000
0.000 | 0.000 |
|
| | | Plot |
Mito |
|
Lyso or Perox |
|
ER |
Golgi |
PM |
Cytosol |
Nucleus |
|
| Expt B |
2
peptides |
5
spectra |
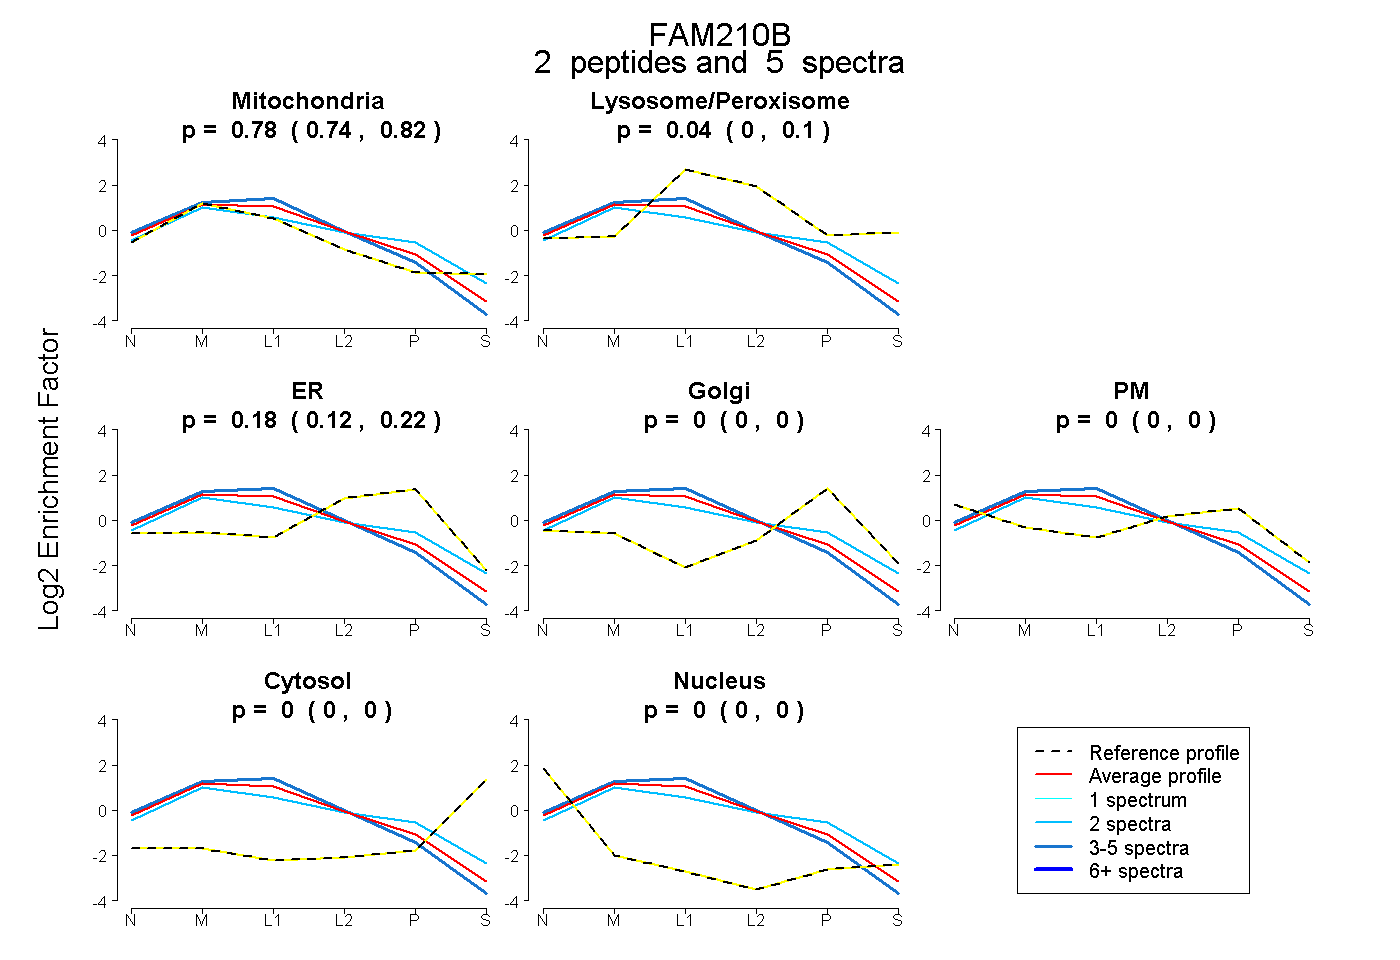 |
0.784
0.738 | 0.820 |
|
0.036
0.000 | 0.104 |
|
0.179
0.117 | 0.221 |
0.000
0.000 | 0.000 |
0.000
0.000 | 0.000 |
0.000
0.000 | 0.000 |
0.000
0.000 | 0.000 |
|
| 2 spectra, TTDPGSGATSTEK |
0.655 |
|
0.045 |
|
0.300 |
0.000 |
0.000 |
0.000 |
0.000 |
|
| 3 spectra, LFAPVR |
0.871 |
|
0.030 |
|
0.099 |
0.000 |
0.000 |
0.000 |
0.000 |
|
| | | Plot |
|
Lyso |
|
|
|
|
|
|
|
Other |
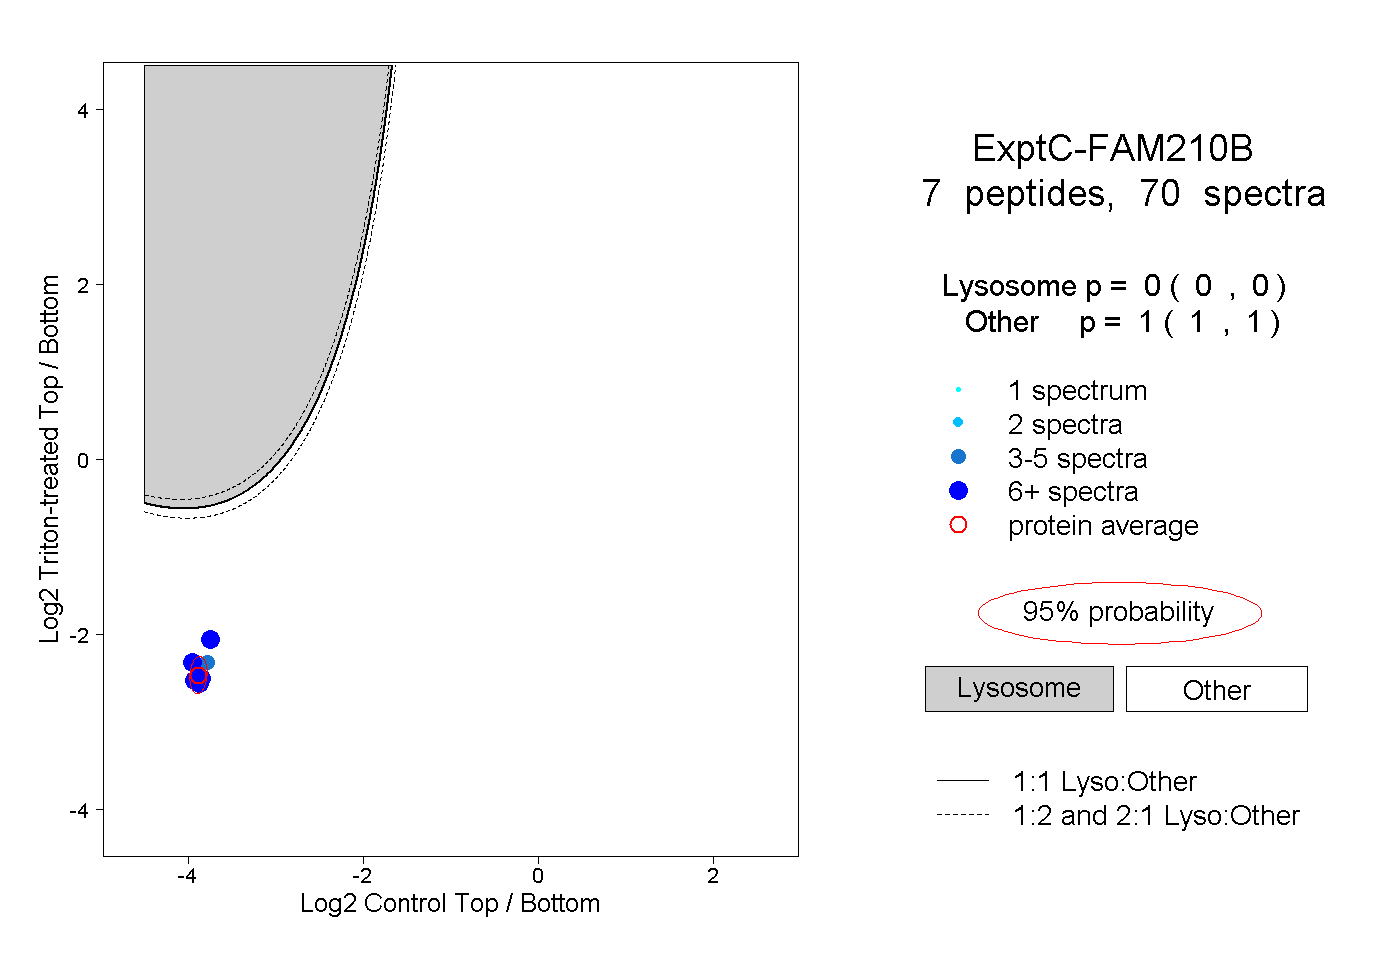
| Expt C |
7
peptides |
70
spectra |
 |
|
0.000
0.000 | 0.000 |
|
|
|
|
|
|
|
1.000
1.000 | 1.000 |
| | | Plot |
|
Lyso |
|
|
|
|
|
|
|
Other |
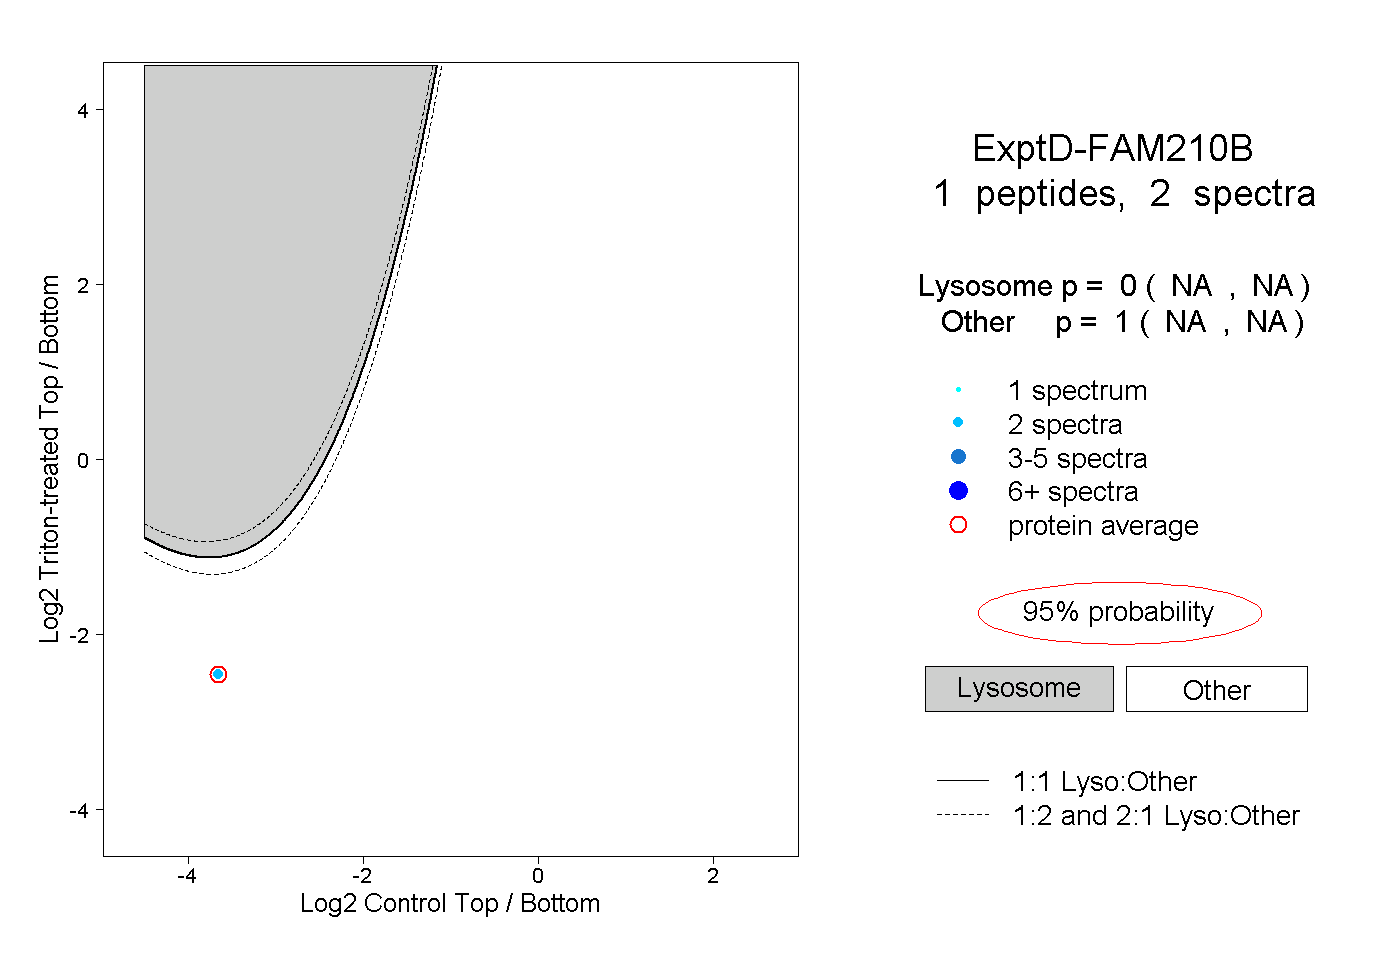
| Expt D |
1
peptide |
2
spectra |
 |
|
0.000
NA | NA |
|
|
|
|
|
|
|
1.000
NA | NA |