 22
22peptides
spectra
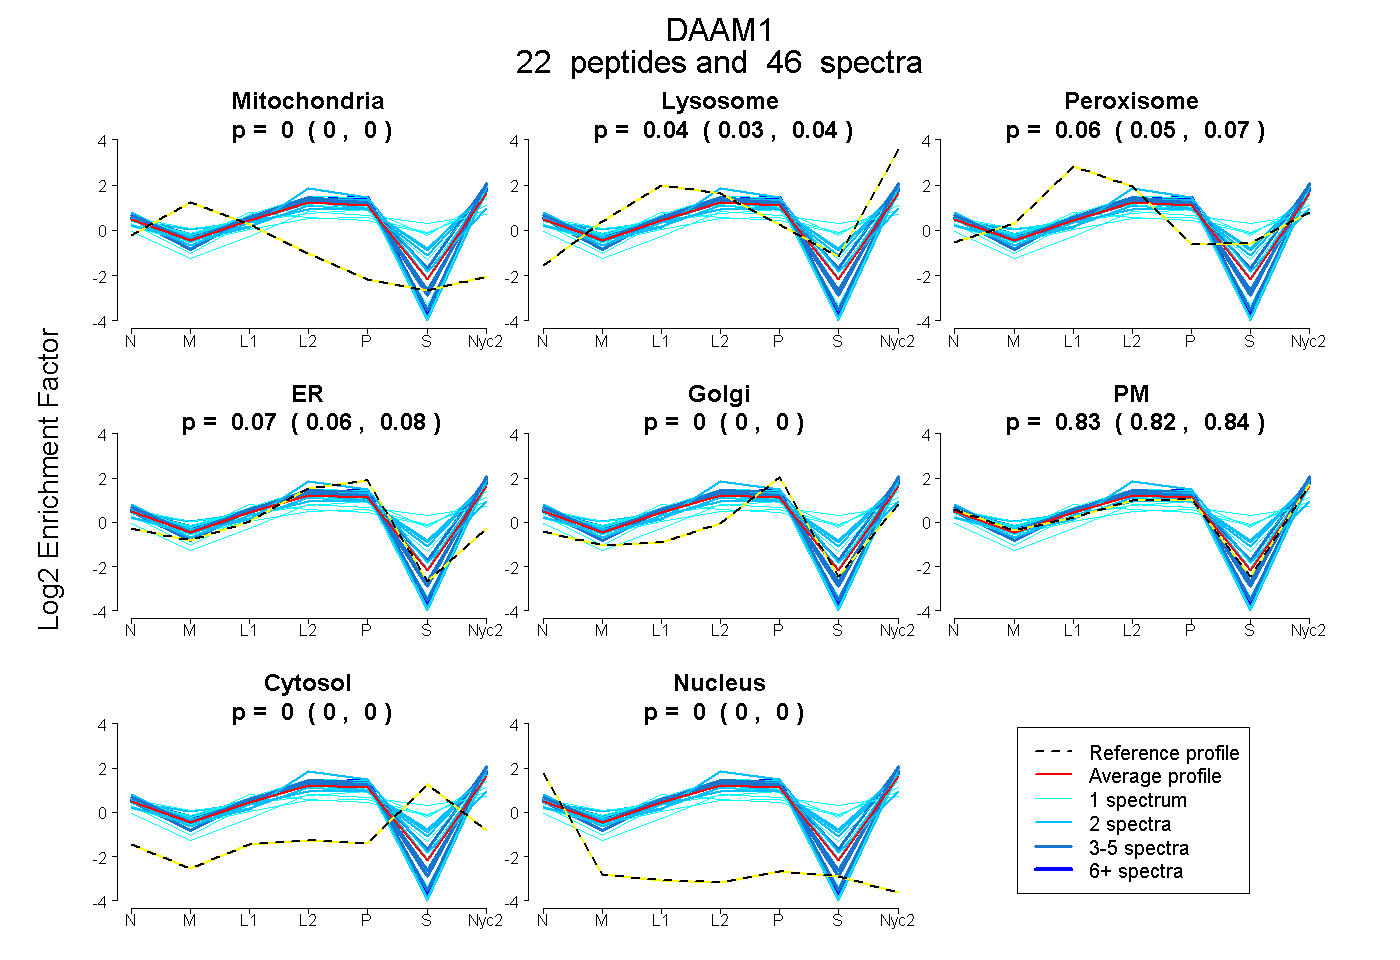
0.000 | 0.000
0.030 | 0.042
0.049 | 0.070
0.060 | 0.076
0.000 | 0.000
0.825 | 0.843
0.000 | 0.001
0.000 | 0.000
4peptides
spectra
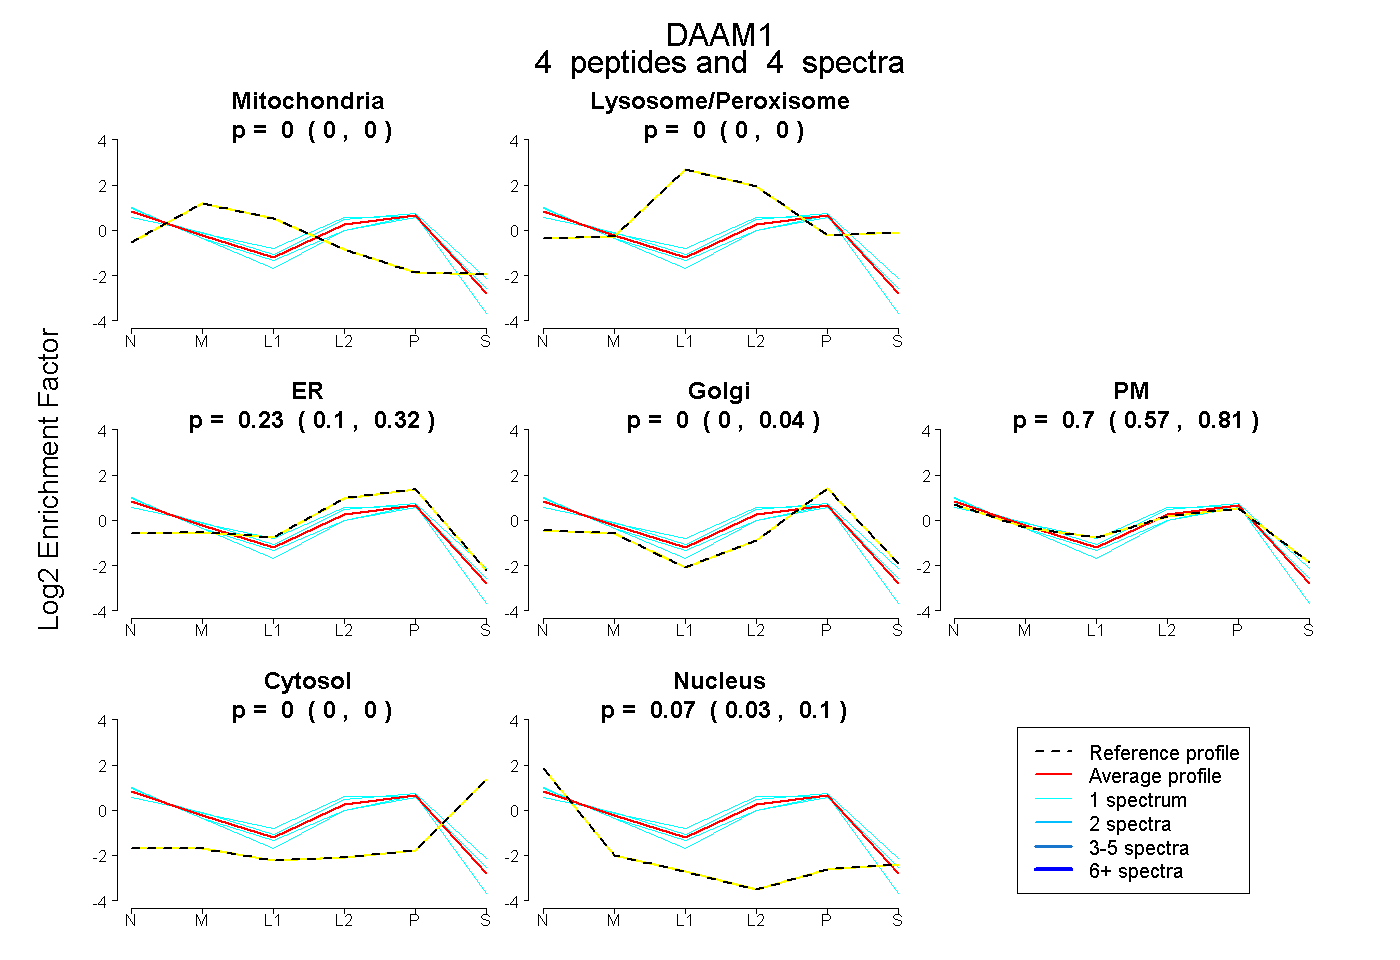
0.000 | 0.000
0.000 | 0.000
0.105 | 0.320
0.000 | 0.043
0.568 | 0.814
0.000 | 0.000
0.030 | 0.098
27peptides
spectra
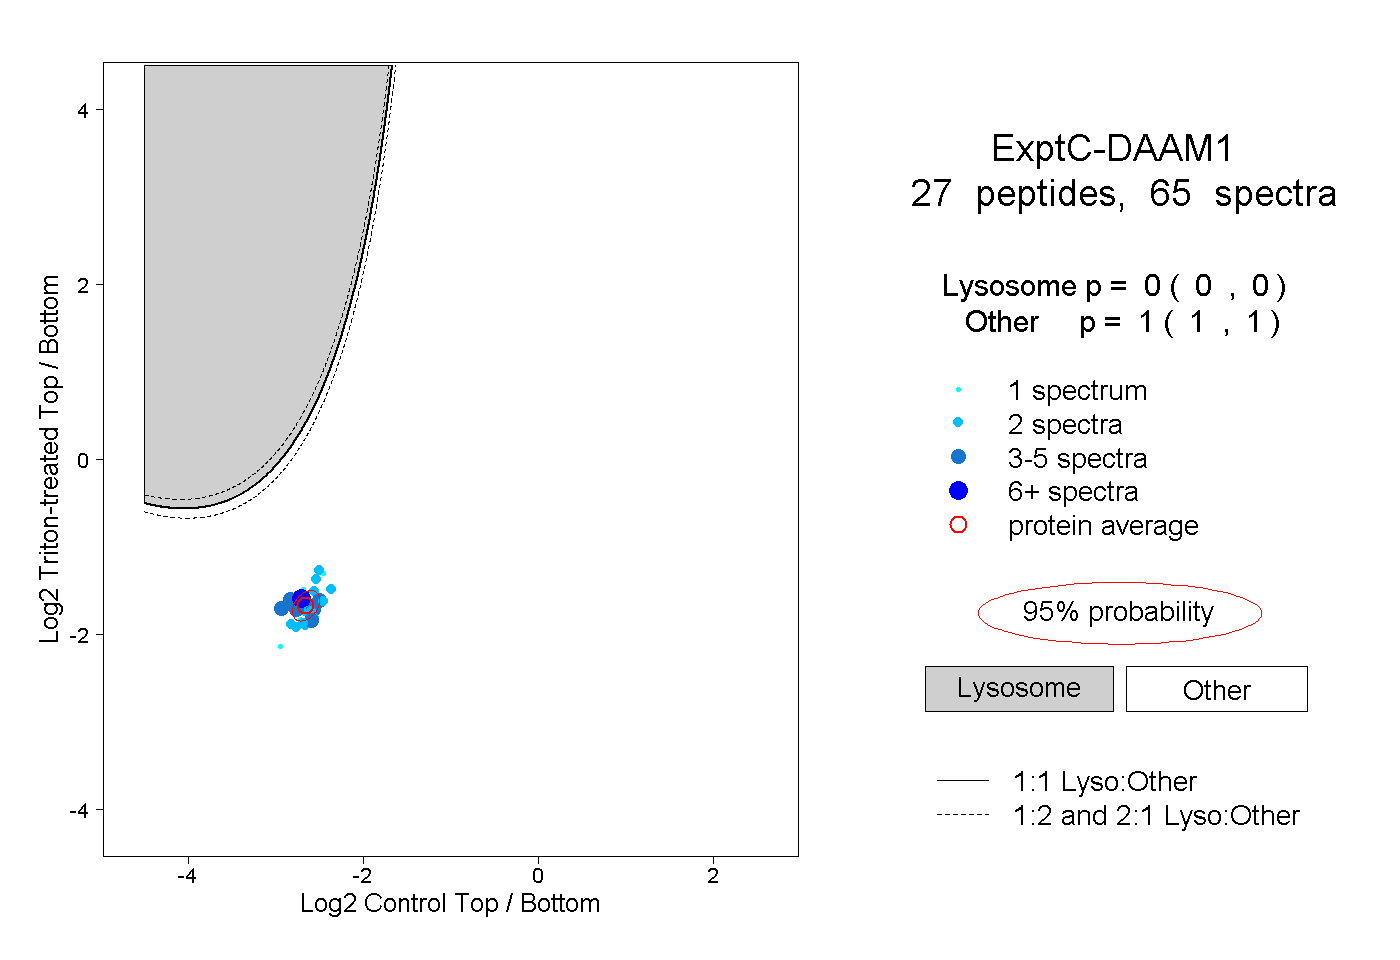
0.000 | 0.000
1.000 | 1.000
3peptides
spectra
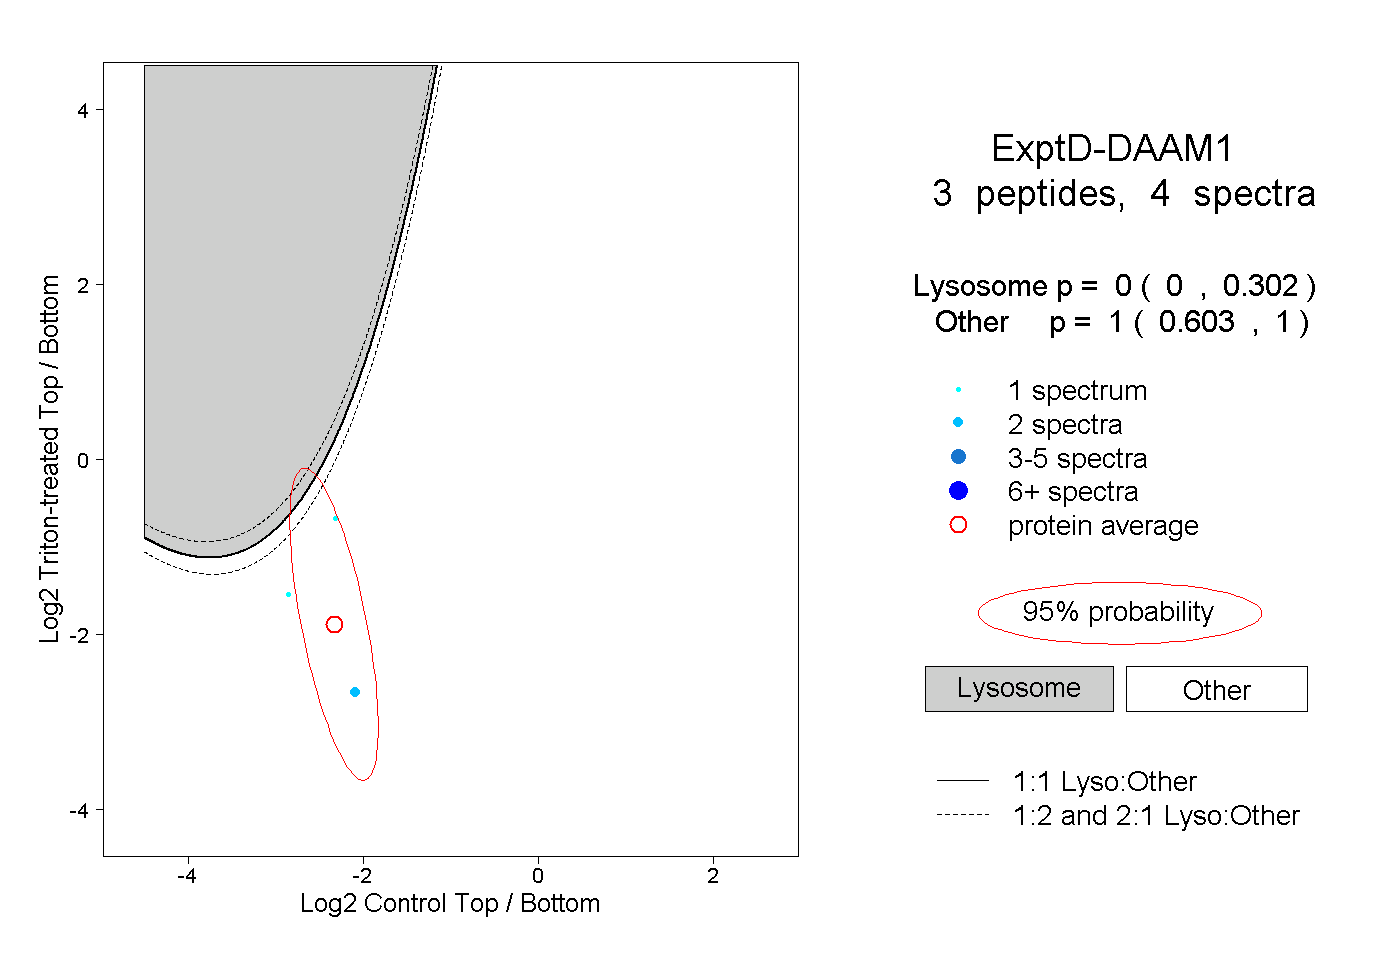
0.000 | 0.302
0.603 | 1.000