DAAM1
[ENSRNOP00000005846]
Main page
| | | Plot |
Mito |
Lyso |
|
Perox |
ER |
Golgi |
PM |
Cytosol |
Nucleus |
|
| Expt A |
 22
22
peptides |
46
spectra |
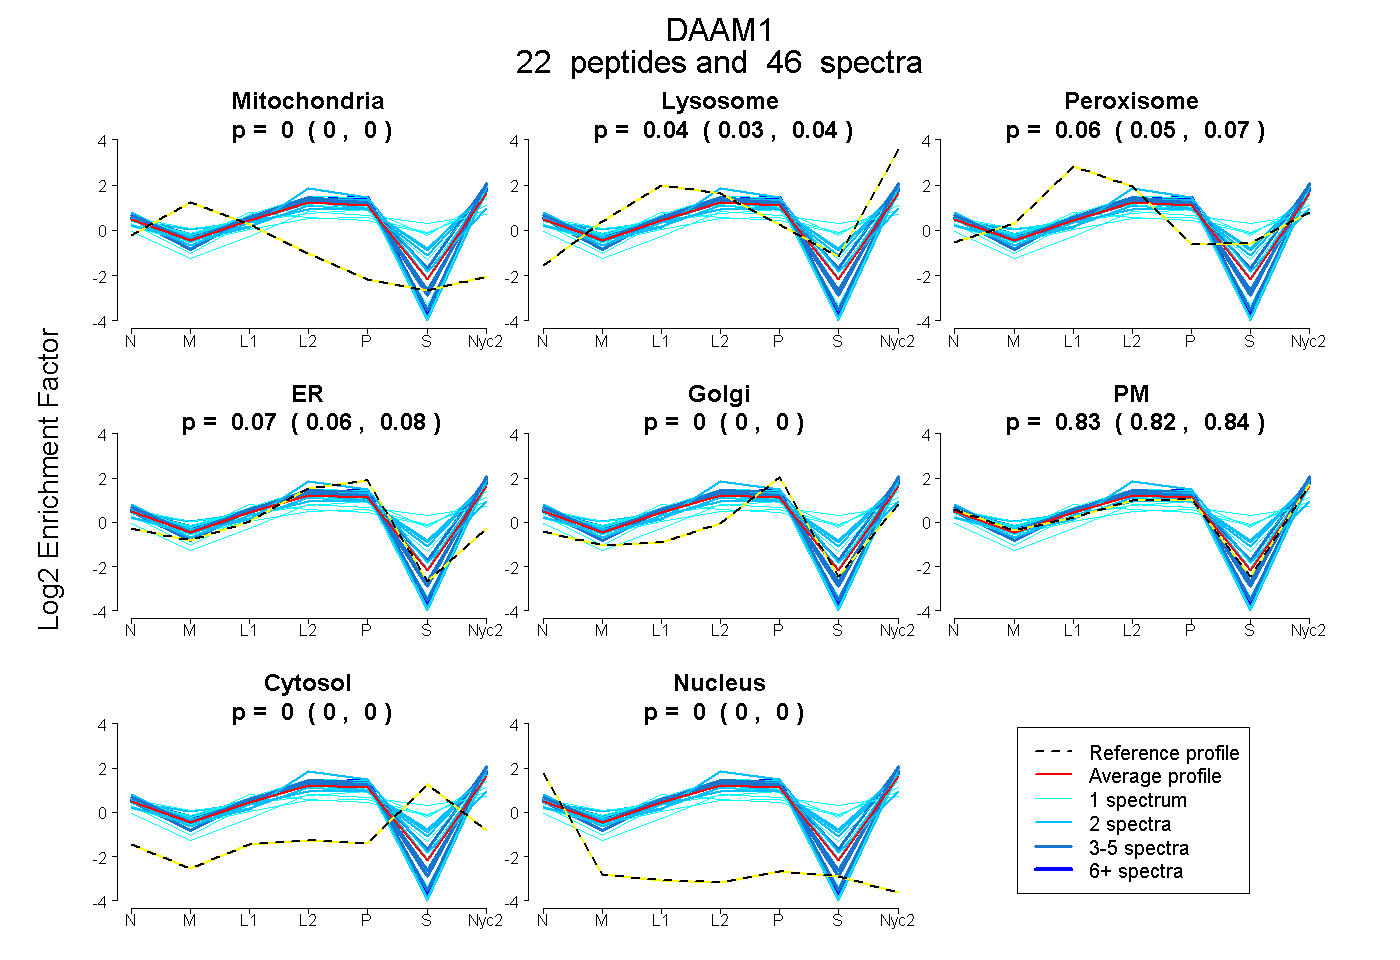 |
0.000
0.000 | 0.000 |
0.037
0.030 | 0.042 |
|
0.060
0.049 | 0.070 |
0.068
0.060 | 0.076 |
0.000
0.000 | 0.000 |
0.834
0.825 | 0.843 |
0.000
0.000 | 0.001 |
0.000
0.000 | 0.000 |
|
| | | Plot |
Mito |
|
Lyso or Perox |
|
ER |
Golgi |
PM |
Cytosol |
Nucleus |
|
| Expt B |
4
peptides |
4
spectra |
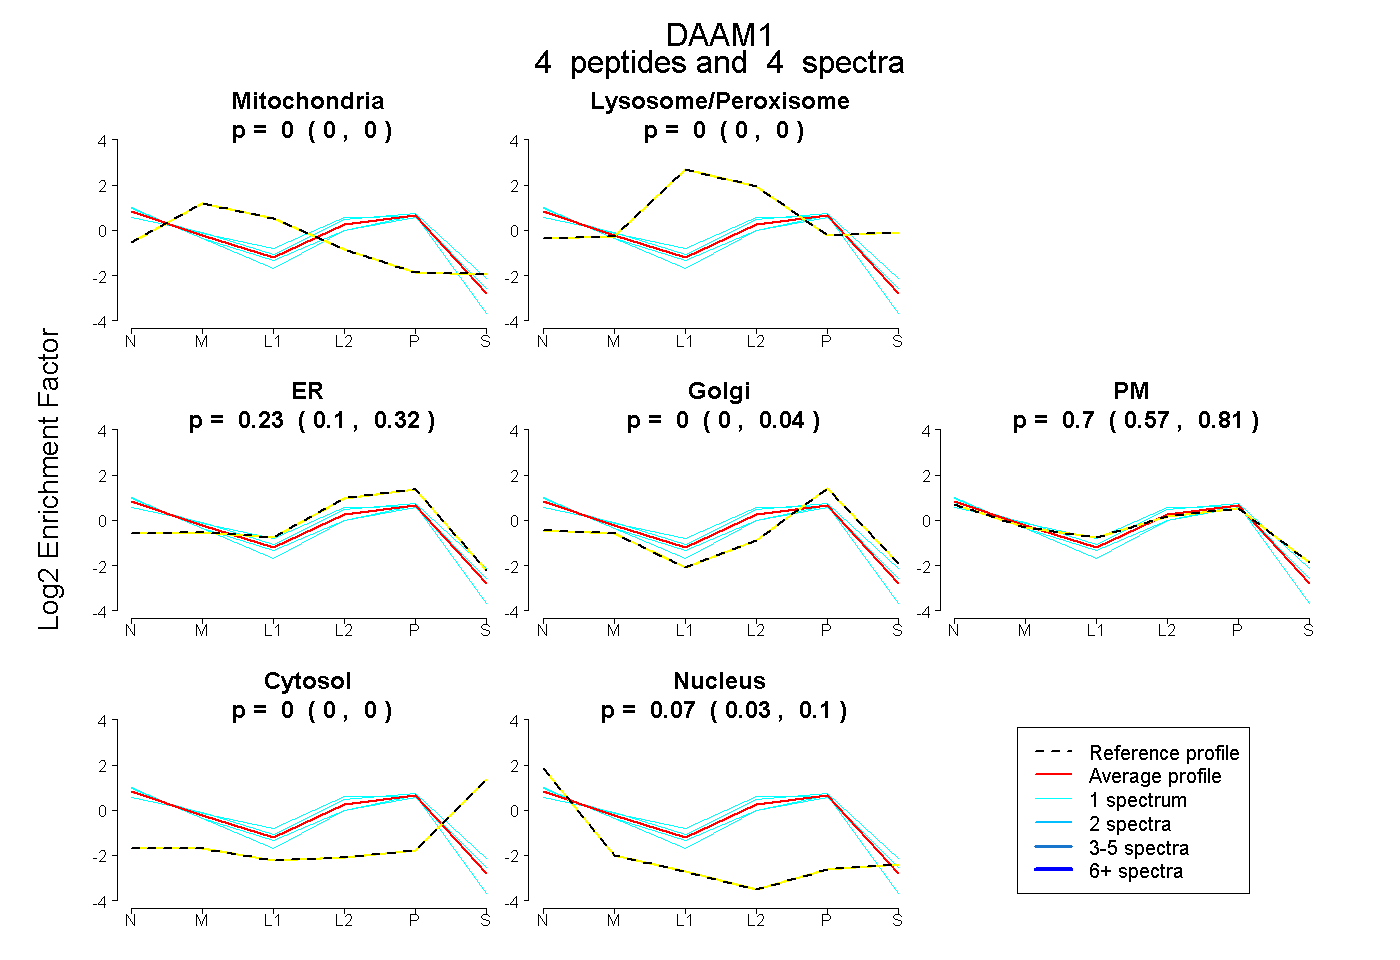 |
0.000
0.000 | 0.000 |
|
0.000
0.000 | 0.000 |
|
0.233
0.105 | 0.320 |
0.000
0.000 | 0.043 |
0.698
0.568 | 0.814 |
0.000
0.000 | 0.000 |
0.068
0.030 | 0.098 |
|
| | | Plot |
|
Lyso |
|
|
|
|
|
|
|
Other |
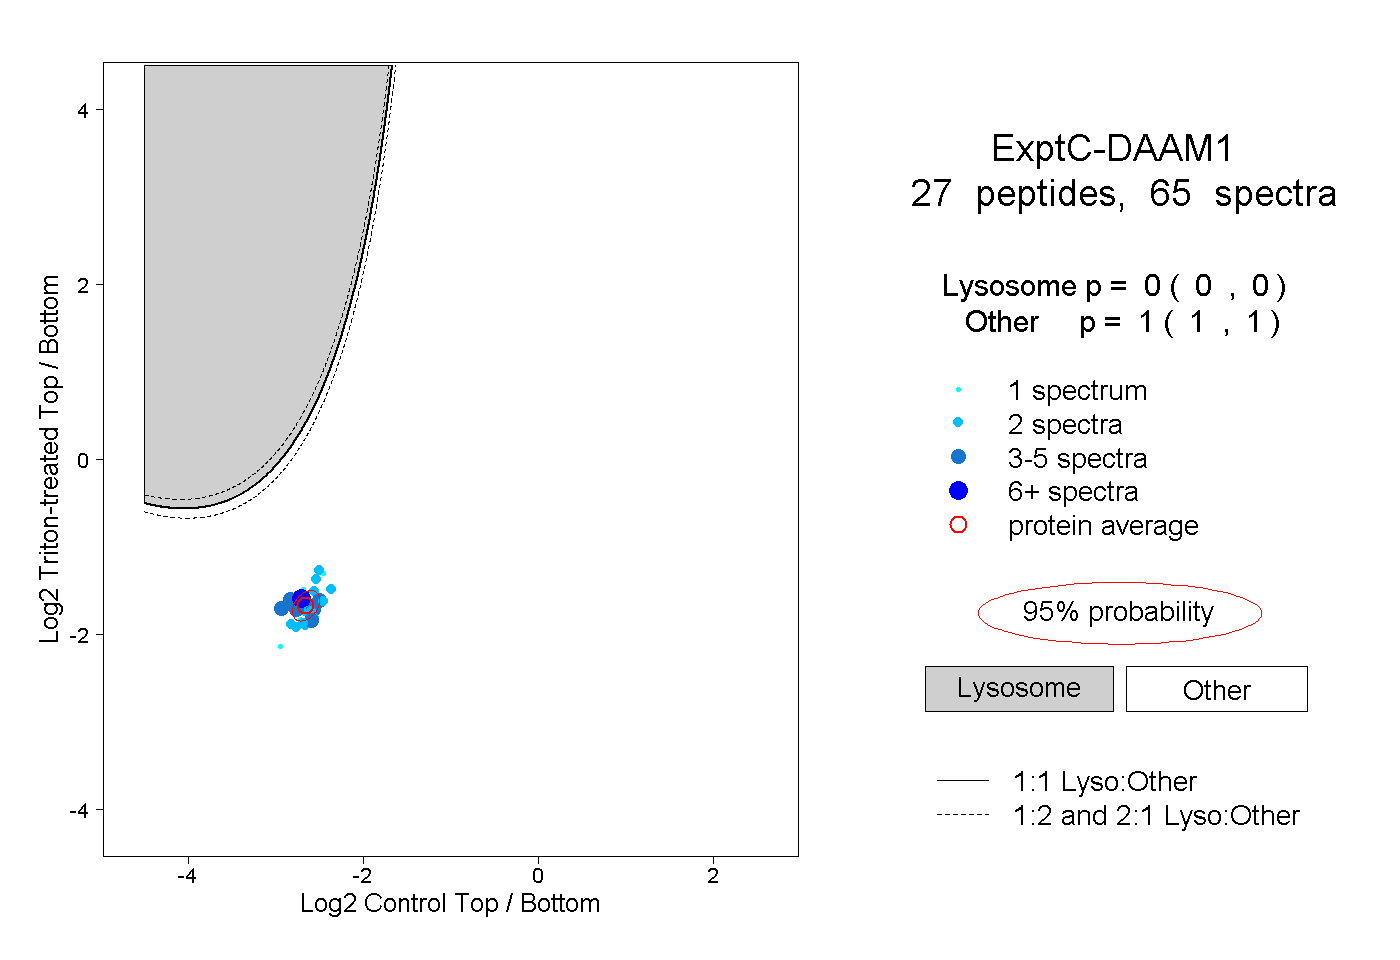
| Expt C |
27
peptides |
65
spectra |
 |
|
0.000
0.000 | 0.000 |
|
|
|
|
|
|
|
1.000
1.000 | 1.000 |
| 5 spectra, INHYQQR |
|
0.000 |
|
|
|
|
|
|
|
1.000 |
| 6 spectra, ISNQVTDSSR |
|
0.000 |
|
|
|
|
|
|
|
1.000 |
| 1 spectrum, ERPITK |
|
0.000 |
|
|
|
|
|
|
|
1.000 |
| 2 spectra, LQSLYFK |
|
0.000 |
|
|
|
|
|
|
|
1.000 |
| 1 spectrum, ETTEHK |
|
0.000 |
|
|
|
|
|
|
|
1.000 |
| 2 spectra, TFSAYQR |
|
0.000 |
|
|
|
|
|
|
|
1.000 |
| 1 spectrum, DQEENK |
|
0.000 |
|
|
|
|
|
|
|
1.000 |
| 2 spectra, LEAQLK |
|
0.000 |
|
|
|
|
|
|
|
1.000 |
| 2 spectra, VLNLSEELR |
|
0.000 |
|
|
|
|
|
|
|
1.000 |
| 1 spectrum, FLFEMSR |
|
0.000 |
|
|
|
|
|
|
|
1.000 |
| 1 spectrum, EADAIDDALSSK |
|
0.000 |
|
|
|
|
|
|
|
1.000 |
| 2 spectra, HFGEEAGK |
|
0.000 |
|
|
|
|
|
|
|
1.000 |
| 4 spectra, GNAYGFK |
|
0.000 |
|
|
|
|
|
|
|
1.000 |
| 5 spectra, ILDLEDLER |
|
0.000 |
|
|
|
|
|
|
|
1.000 |
| 3 spectra, HLDFFEMLR |
|
0.000 |
|
|
|
|
|
|
|
1.000 |
| 2 spectra, ELSVIDGR |
|
0.000 |
|
|
|
|
|
|
|
1.000 |
| 3 spectra, TMDYETSESR |
|
0.000 |
|
|
|
|
|
|
|
1.000 |
| 3 spectra, SQPPQPGDK |
|
0.000 |
|
|
|
|
|
|
|
1.000 |
| 2 spectra, VAEVKPK |
|
0.000 |
|
|
|
|
|
|
|
1.000 |
| 2 spectra, FELVHIDTK |
|
0.000 |
|
|
|
|
|
|
|
1.000 |
| 2 spectra, NEDELEFAK |
|
0.000 |
|
|
|
|
|
|
|
1.000 |
| 4 spectra, EHNELQQK |
|
0.000 |
|
|
|
|
|
|
|
1.000 |
| 2 spectra, ALMNNSQGR |
|
0.000 |
|
|
|
|
|
|
|
1.000 |
| 2 spectra, SATQMFELTR |
|
0.000 |
|
|
|
|
|
|
|
1.000 |
| 1 spectrum, DMLEQLLK |
|
0.000 |
|
|
|
|
|
|
|
1.000 |
| 2 spectra, SSSEEVLR |
|
0.000 |
|
|
|
|
|
|
|
1.000 |
| 2 spectra, NNDHPEITYR |
|
0.000 |
|
|
|
|
|
|
|
1.000 |
| | | Plot |
|
Lyso |
|
|
|
|
|
|
|
Other |
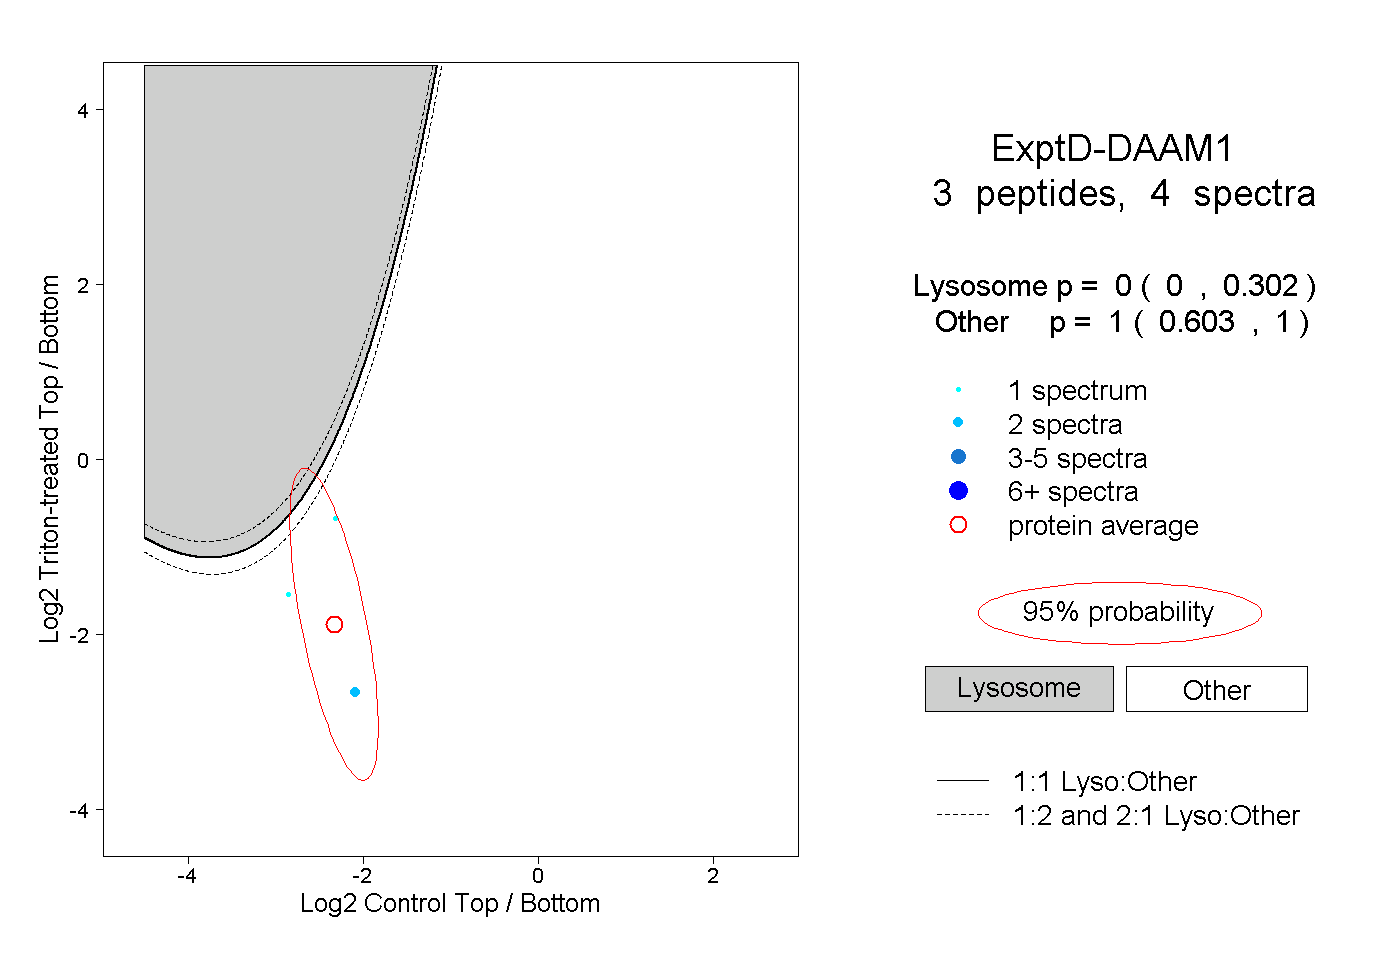
| Expt D |
3
peptides |
4
spectra |
 |
|
0.000
0.000 | 0.302 |
|
|
|
|
|
|
|
1.000
0.603 | 1.000 |