 20
20peptides
spectra
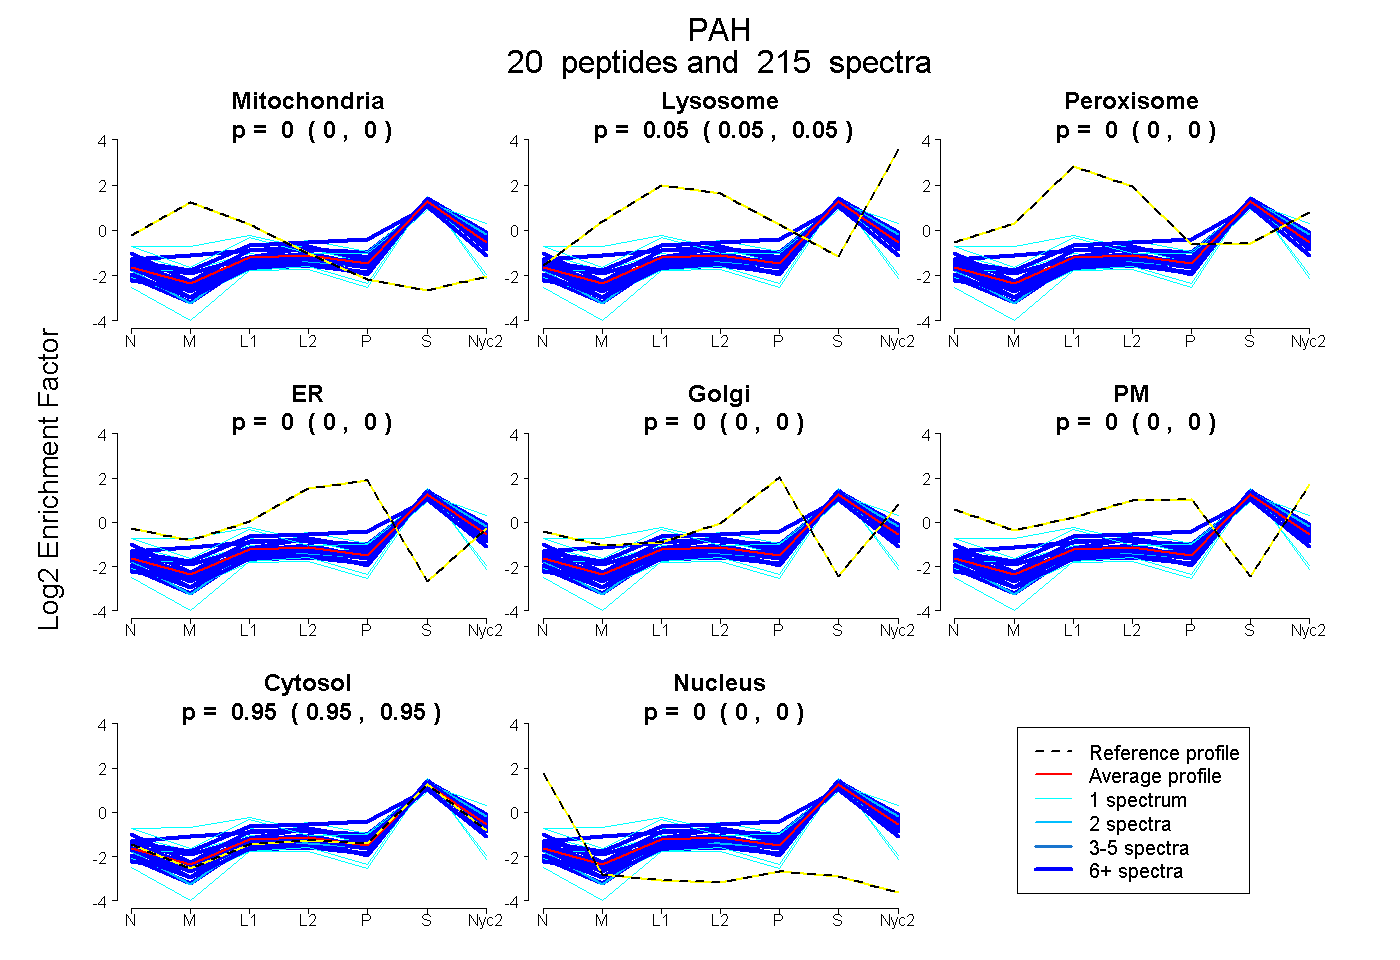
0.000 | 0.000
0.047 | 0.050
0.000 | 0.000
0.000 | 0.000
0.000 | 0.000
0.000 | 0.000
0.949 | 0.952
0.000 | 0.000
19peptides
spectra
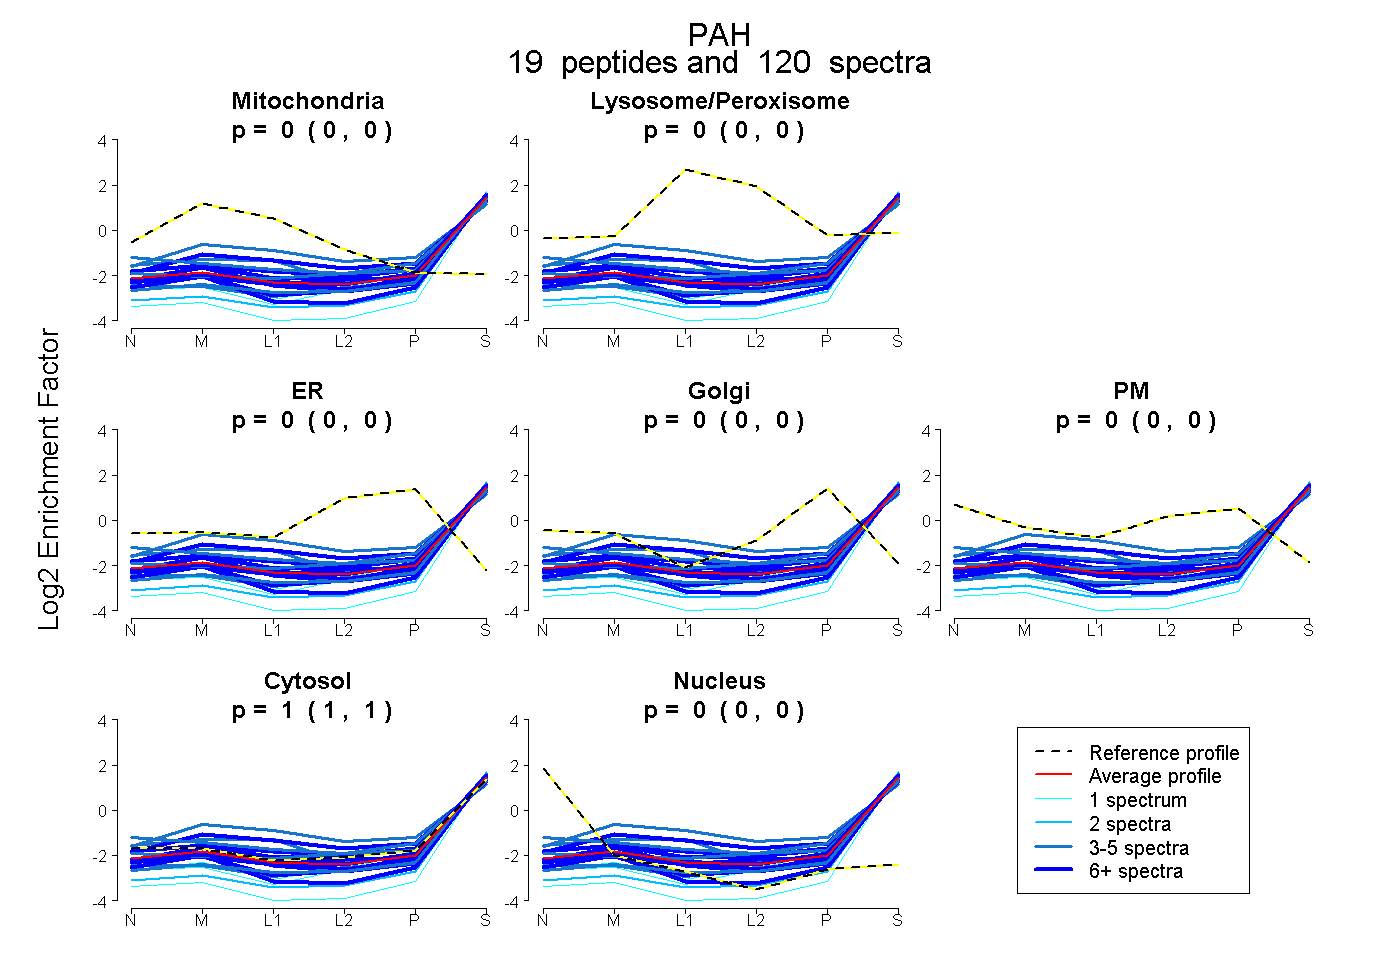
0.000 | 0.000
0.000 | 0.000
0.000 | 0.000
0.000 | 0.000
0.000 | 0.000
1.000 | 1.000
0.000 | 0.000
17peptides
spectra
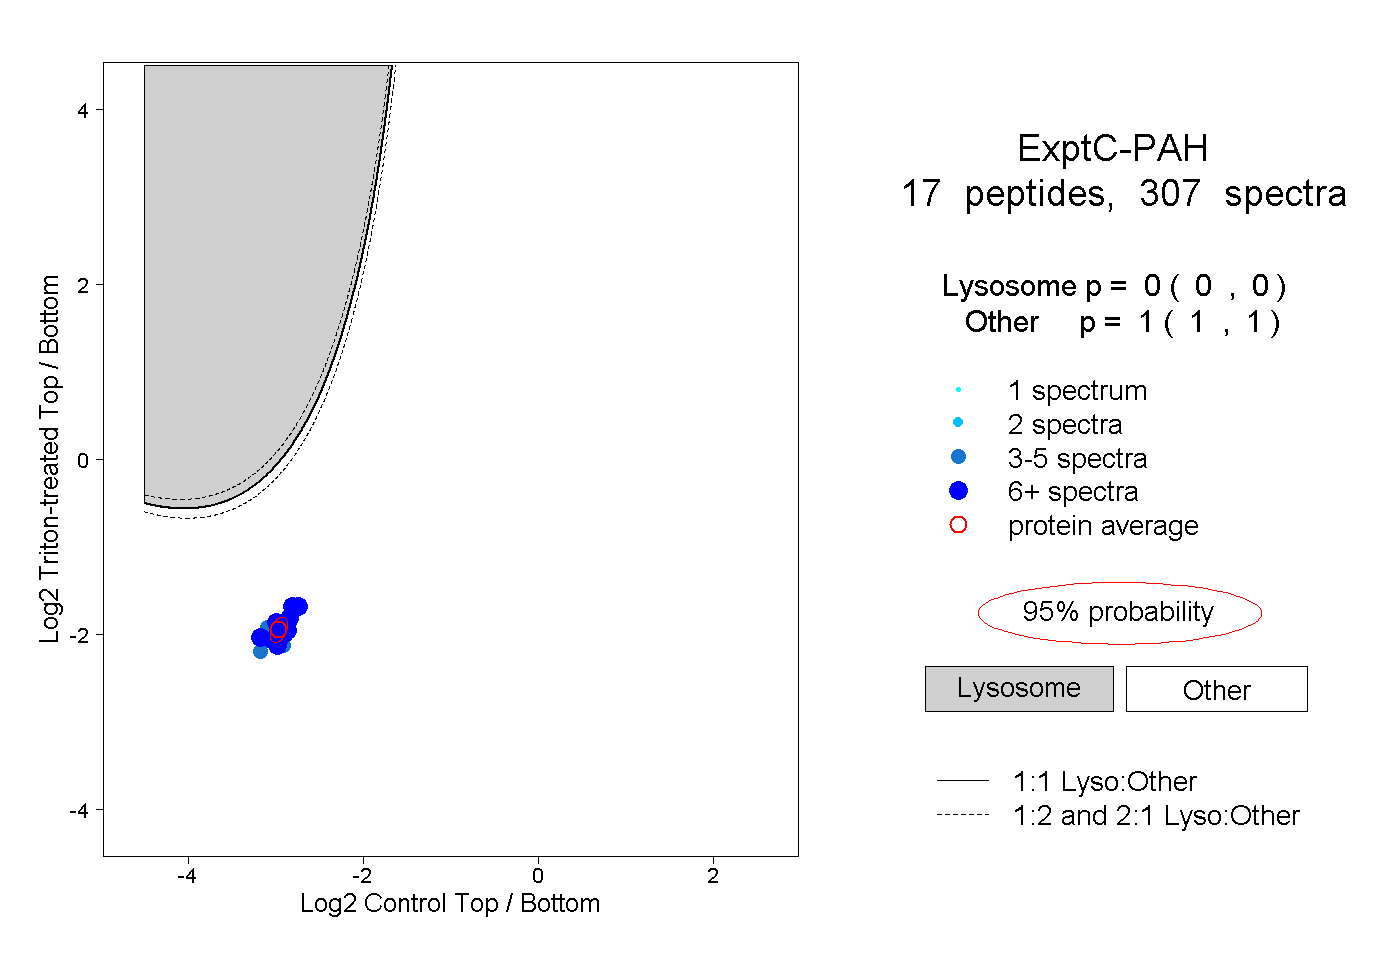
0.000 | 0.000
1.000 | 1.000
6peptides
spectra
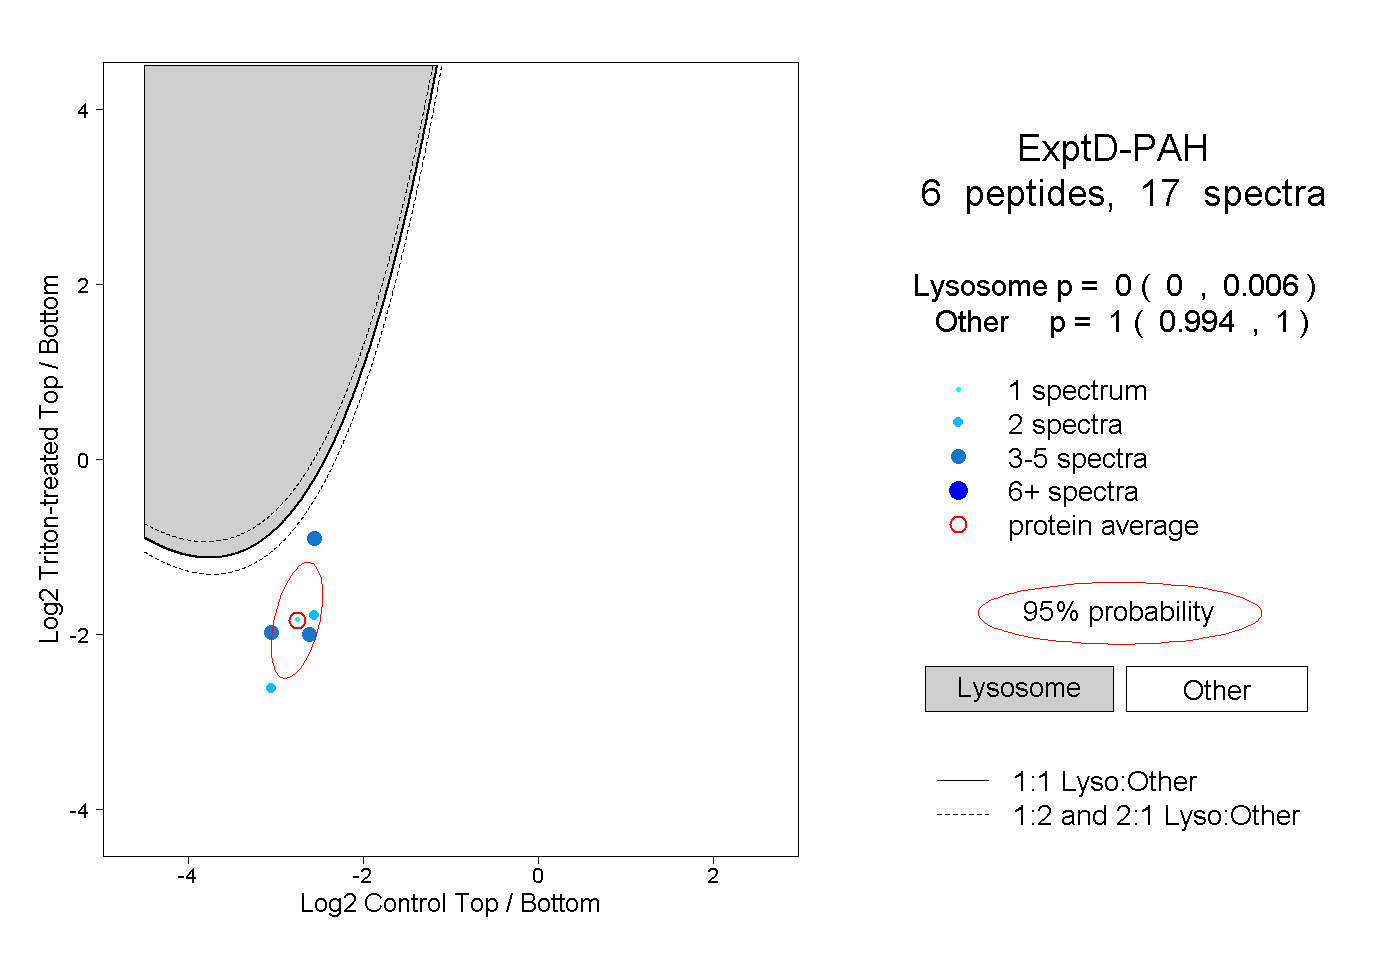
0.000 | 0.006
0.994 | 1.000