 20
20peptides
spectra
0.000 | 0.000
0.047 | 0.050
0.000 | 0.000
0.000 | 0.000
0.000 | 0.000
0.000 | 0.000
0.949 | 0.952
0.000 | 0.000
| Plot | Mito | Lyso | Perox | ER | Golgi | PM | Cytosol | Nucleus | |||||
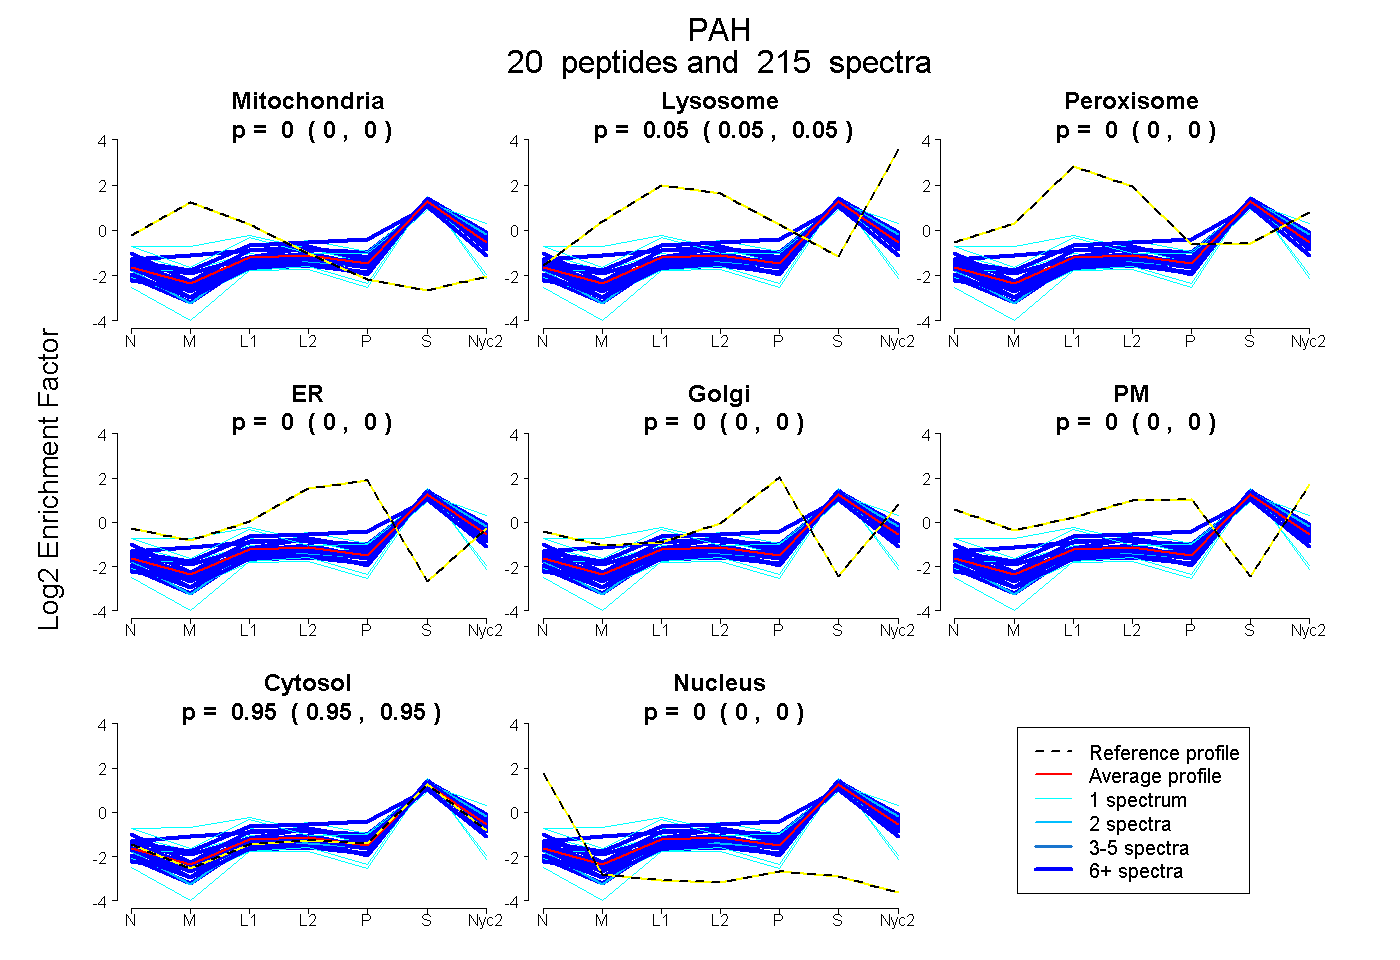
| Expt A |
20 peptides |
215 spectra |
|
0.000 0.000 | 0.000 |
0.049 0.047 | 0.050 |
0.000 0.000 | 0.000 |
0.000 0.000 | 0.000 |
0.000 0.000 | 0.000 |
0.000 0.000 | 0.000 |
0.951 0.949 | 0.952 |
0.000 0.000 | 0.000 |
| 8 spectra, VEVLDNTQQLK | 0.013 | 0.002 | 0.015 | 0.000 | 0.000 | 0.000 | 0.970 | 0.000 | ||
| 19 spectra, QTWGTVFR | 0.000 | 0.037 | 0.000 | 0.000 | 0.000 | 0.000 | 0.963 | 0.000 | ||
| 1 spectrum, DEYEFFTYLDK | 0.051 | 0.088 | 0.002 | 0.000 | 0.000 | 0.000 | 0.859 | 0.000 | ||
| 1 spectrum, SFAQFSQEIGLASLGAPDEYIEK | 0.000 | 0.234 | 0.000 | 0.000 | 0.000 | 0.000 | 0.766 | 0.000 | ||
| 12 spectra, QFADIAYNYR | 0.000 | 0.062 | 0.000 | 0.000 | 0.000 | 0.000 | 0.938 | 0.000 | ||
| 17 spectra, DFLGGLAFR | 0.000 | 0.000 | 0.000 | 0.000 | 0.000 | 0.000 | 1.000 | 0.000 | ||
| 1 spectrum, ILADSINSEVGILCNALQK | 0.000 | 0.000 | 0.000 | 0.000 | 0.000 | 0.000 | 0.957 | 0.043 | ||
| 9 spectra, VFHCTQYIR | 0.000 | 0.000 | 0.105 | 0.127 | 0.000 | 0.000 | 0.768 | 0.000 | ||
| 11 spectra, LLPLELEK | 0.000 | 0.010 | 0.000 | 0.000 | 0.000 | 0.000 | 0.990 | 0.000 | ||
| 2 spectra, SKPVLGSIIK | 0.000 | 0.005 | 0.000 | 0.000 | 0.000 | 0.000 | 0.995 | 0.000 | ||
| 30 spectra, YDPYTQR | 0.000 | 0.049 | 0.000 | 0.000 | 0.000 | 0.000 | 0.951 | 0.000 | ||
| 18 spectra, VEYTEEEK | 0.000 | 0.000 | 0.000 | 0.000 | 0.000 | 0.000 | 1.000 | 0.000 | ||
| 1 spectrum, THACYEHNHIFPLLEK | 0.034 | 0.000 | 0.203 | 0.000 | 0.000 | 0.000 | 0.742 | 0.021 | ||
| 9 spectra, NDIGATVHELSR | 0.000 | 0.000 | 0.095 | 0.000 | 0.000 | 0.051 | 0.854 | 0.000 | ||
| 11 spectra, TIQELDR | 0.000 | 0.013 | 0.000 | 0.000 | 0.000 | 0.000 | 0.987 | 0.000 | ||
| 33 spectra, HGQPIPR | 0.074 | 0.146 | 0.031 | 0.000 | 0.000 | 0.000 | 0.749 | 0.000 | ||
| 1 spectrum, LFEENDINLTHIESRPSR | 0.159 | 0.000 | 0.216 | 0.000 | 0.000 | 0.000 | 0.625 | 0.000 | ||
| 12 spectra, EEVGALAK | 0.004 | 0.000 | 0.000 | 0.000 | 0.000 | 0.000 | 0.991 | 0.005 | ||
| 1 spectrum, EDNIPQLEDVSQFLQTCTGFR | 0.000 | 0.000 | 0.000 | 0.000 | 0.000 | 0.000 | 0.921 | 0.079 | ||
| 18 spectra, NTVPWFPR | 0.000 | 0.131 | 0.000 | 0.000 | 0.000 | 0.000 | 0.869 | 0.000 |
| Plot | Mito | Lyso or Perox | ER | Golgi | PM | Cytosol | Nucleus | ||||||
| Expt B |
19 peptides |
120 spectra |
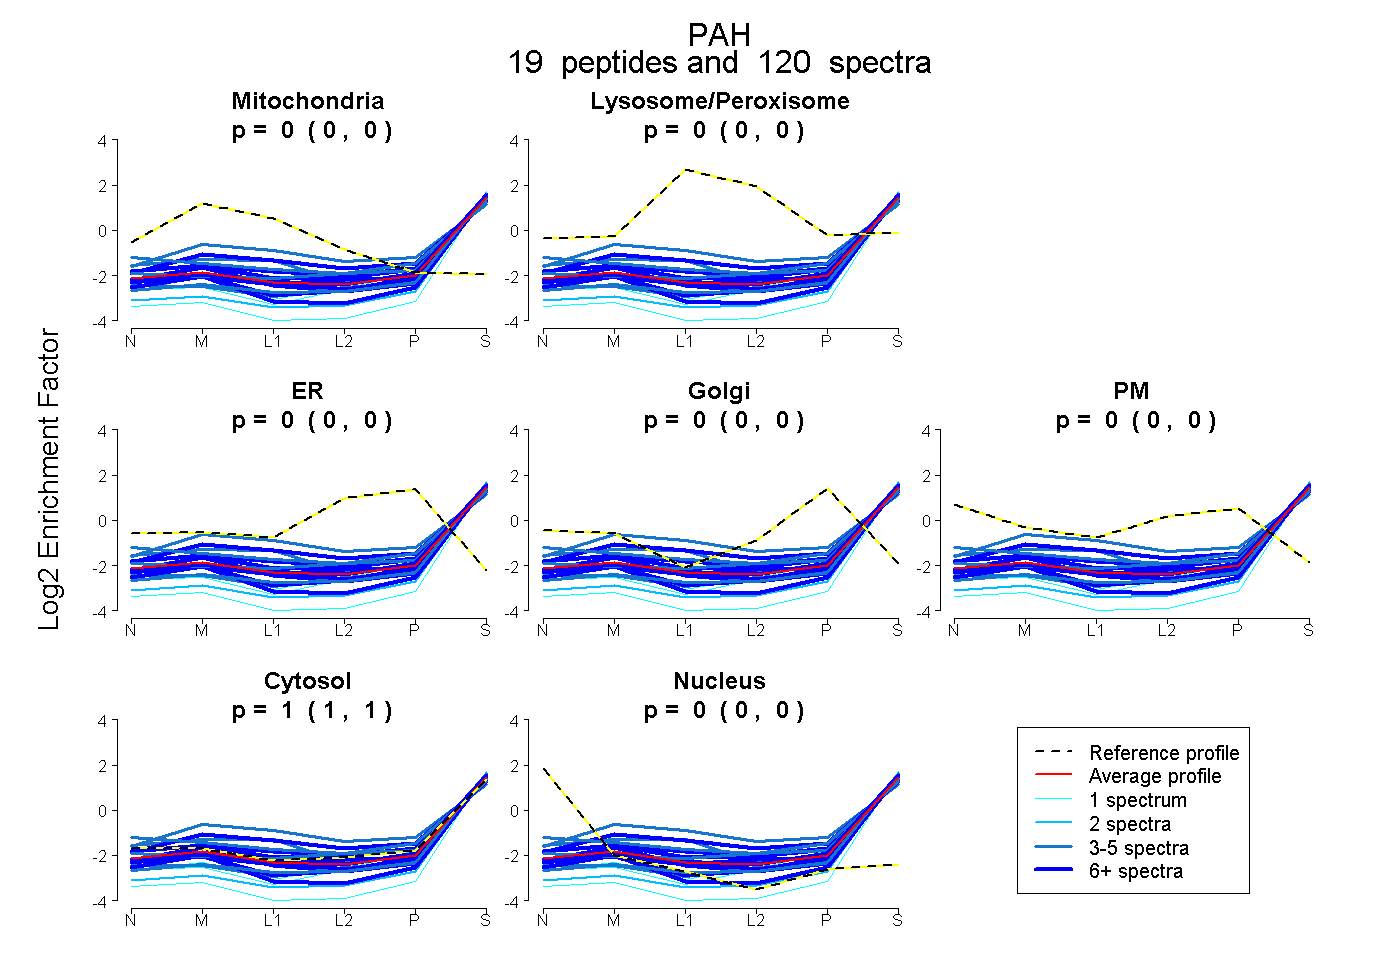 |
0.000 0.000 | 0.000 |
0.000 0.000 | 0.000 |
0.000 0.000 | 0.000 |
0.000 0.000 | 0.000 |
0.000 0.000 | 0.000 |
1.000 1.000 | 1.000 |
0.000 0.000 | 0.000 |
|||
| Plot | Lyso | Other | |||||||||||
| Expt C |
17 peptides |
307 spectra |
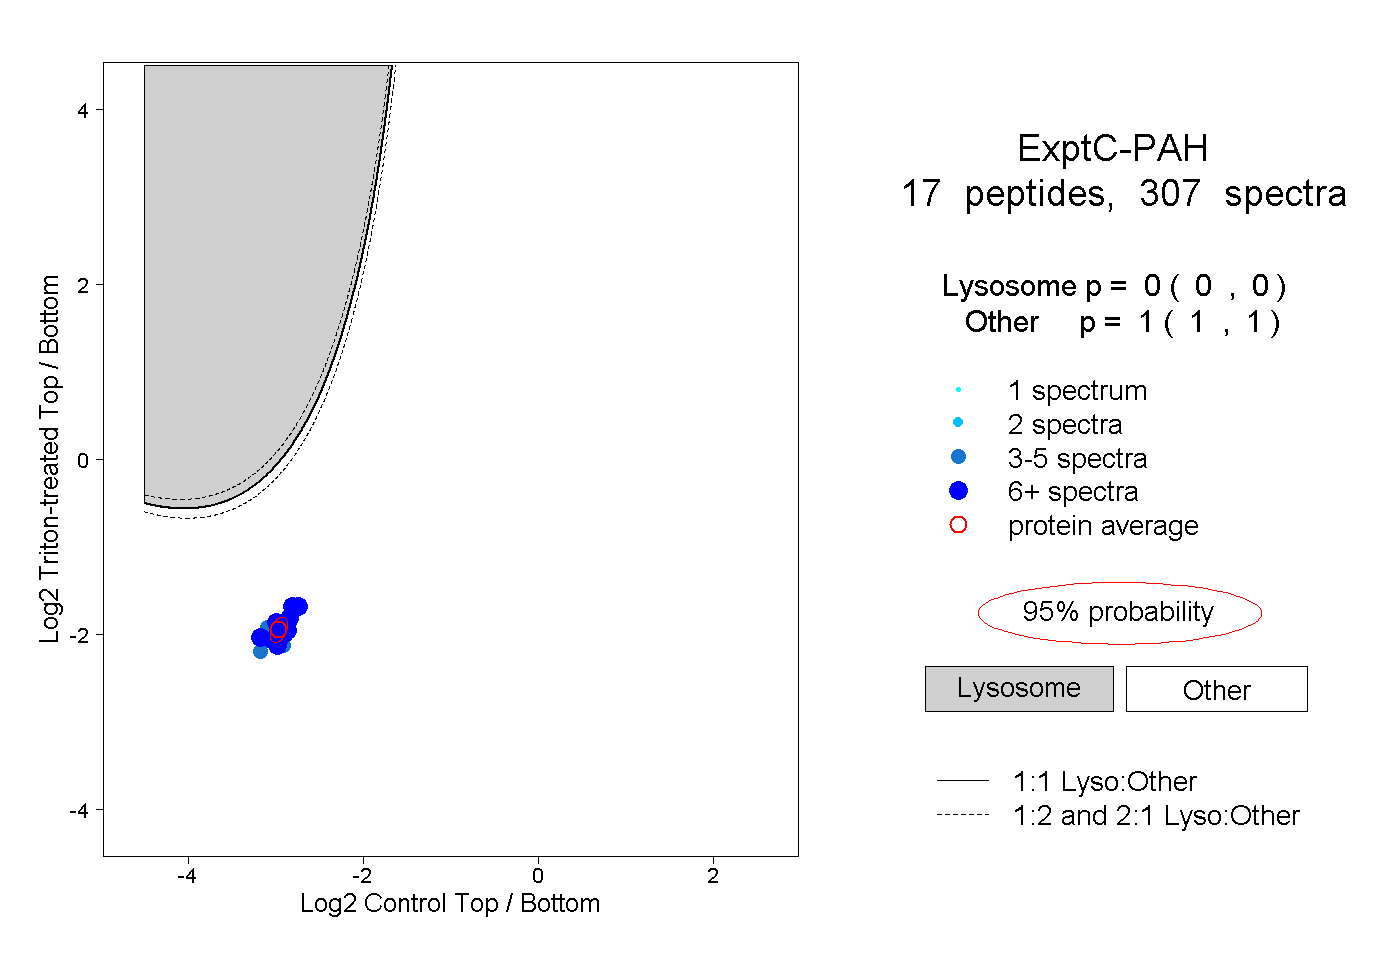 |
0.000 0.000 | 0.000 |
1.000 1.000 | 1.000 |
||||||||
| Plot | Lyso | Other | |||||||||||
| Expt D |
6 peptides |
17 spectra |
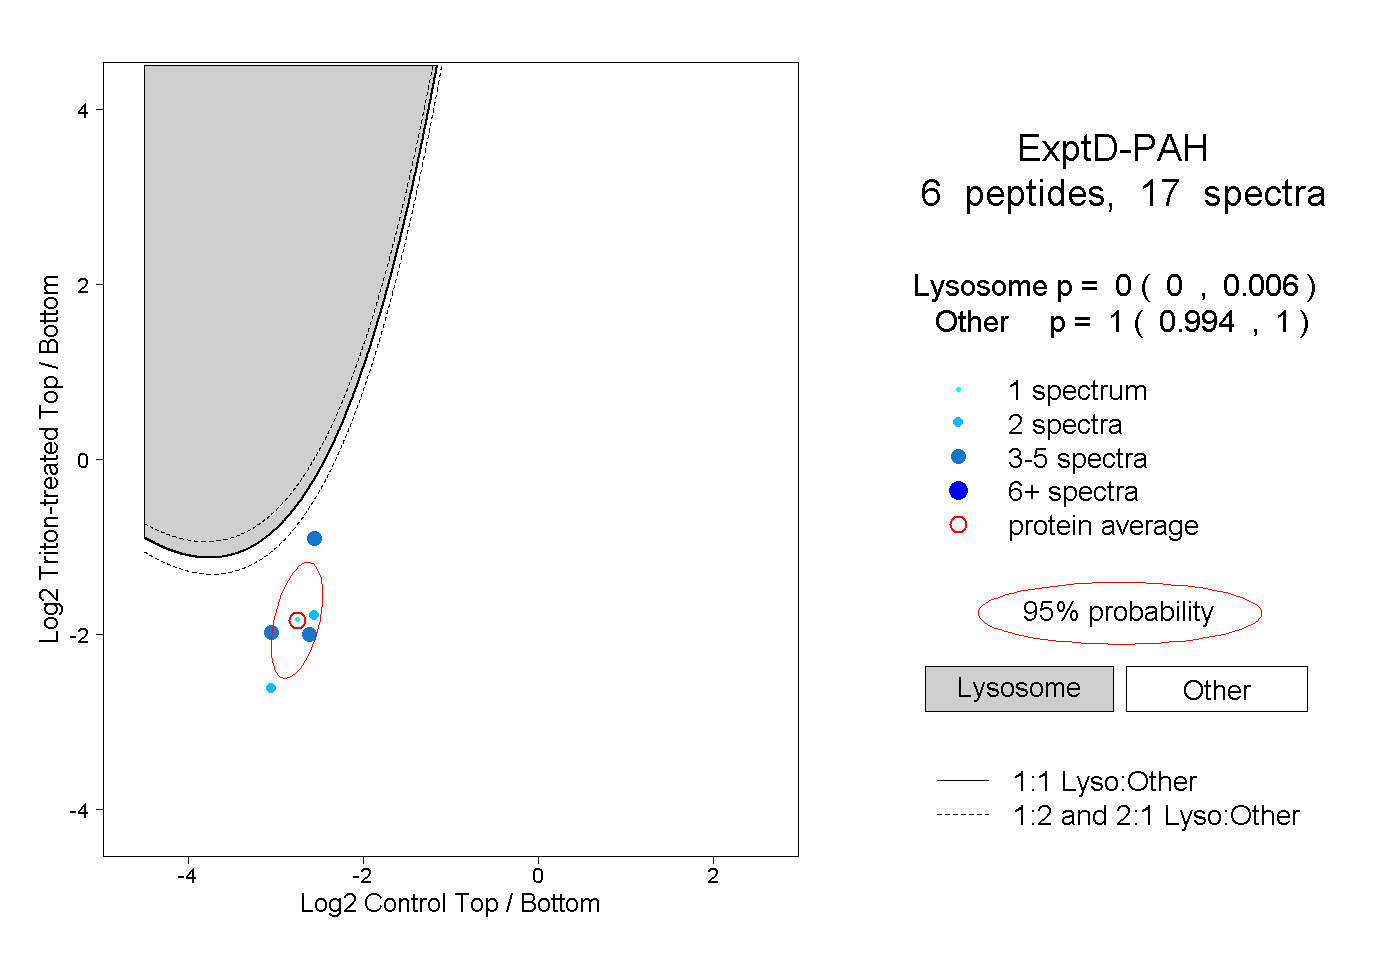 |
0.000 0.000 | 0.006 |
1.000 0.994 | 1.000 |