 9
9peptides
spectra
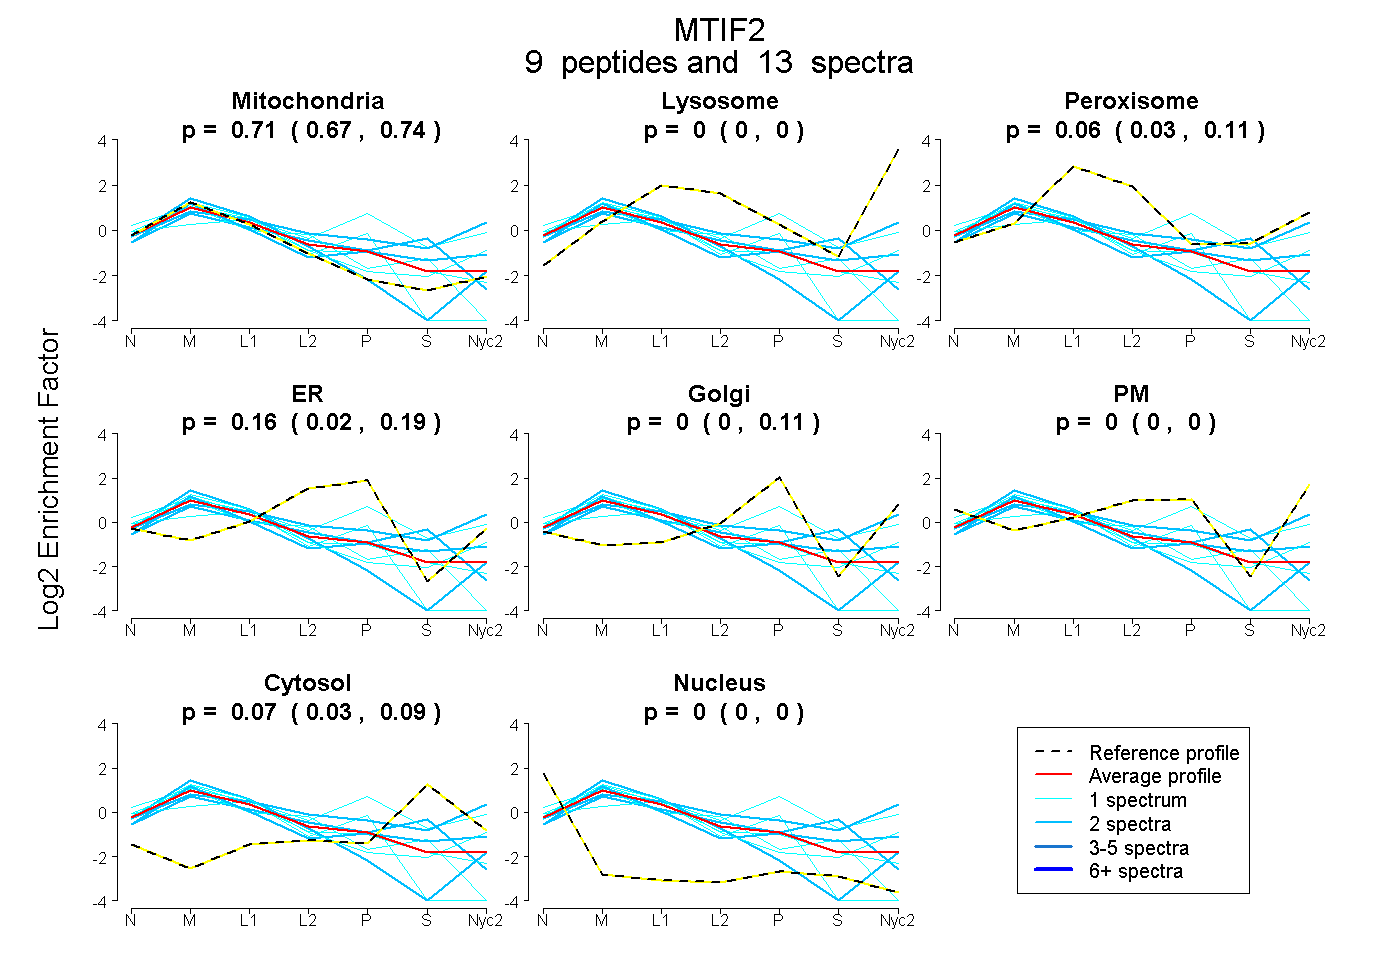
0.668 | 0.741
0.000 | 0.000
0.026 | 0.110
0.021 | 0.185
0.000 | 0.107
0.000 | 0.000
0.030 | 0.093
0.000 | 0.000
1peptide
spectra
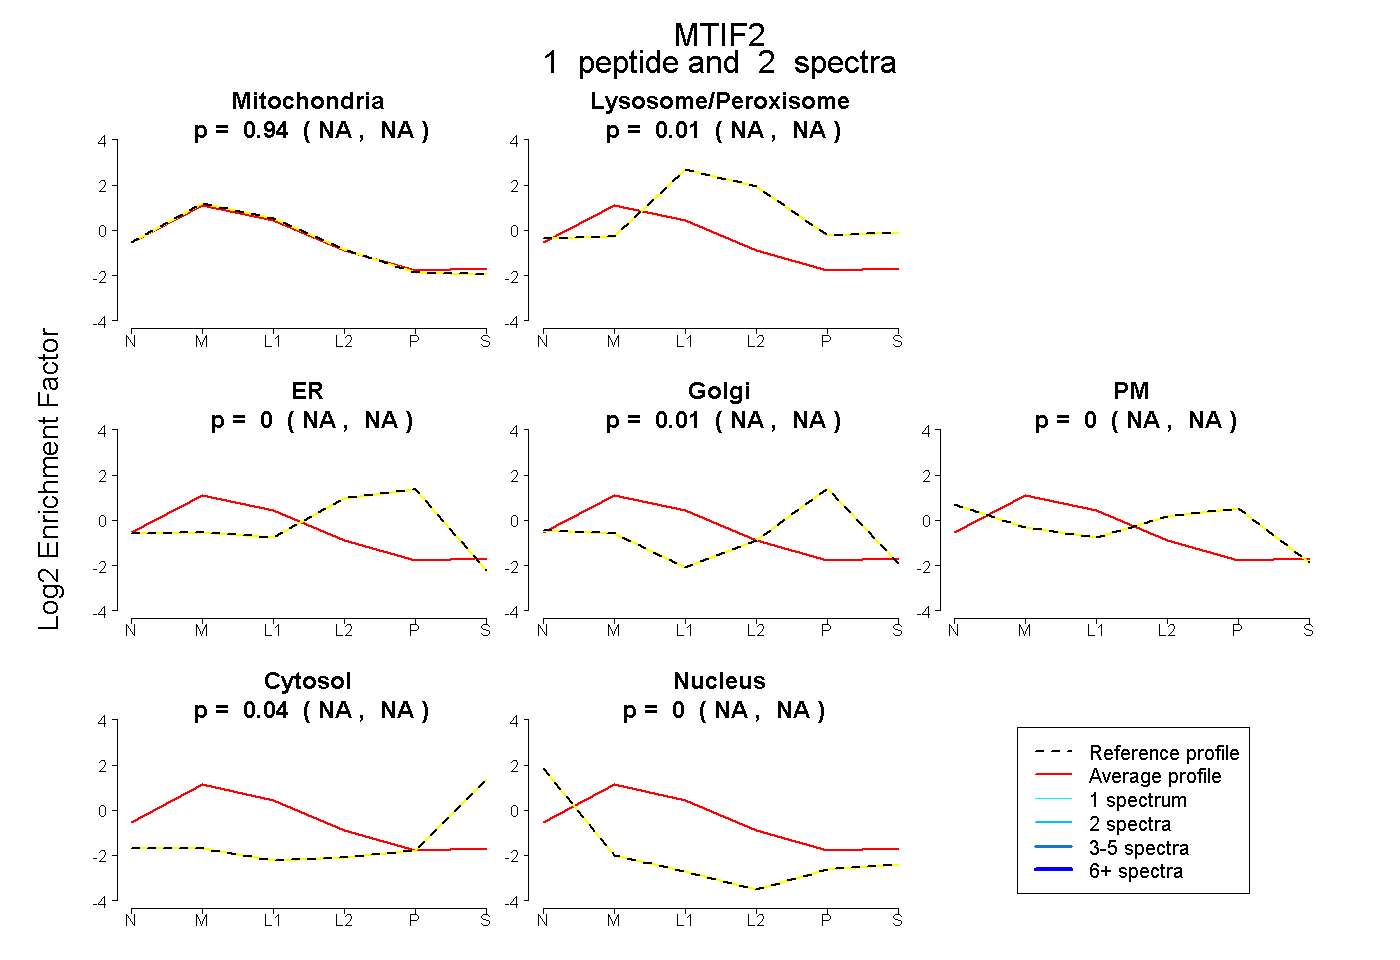
NA | NA
NA | NA
NA | NA
NA | NA
NA | NA
NA | NA
NA | NA
9peptides
spectra
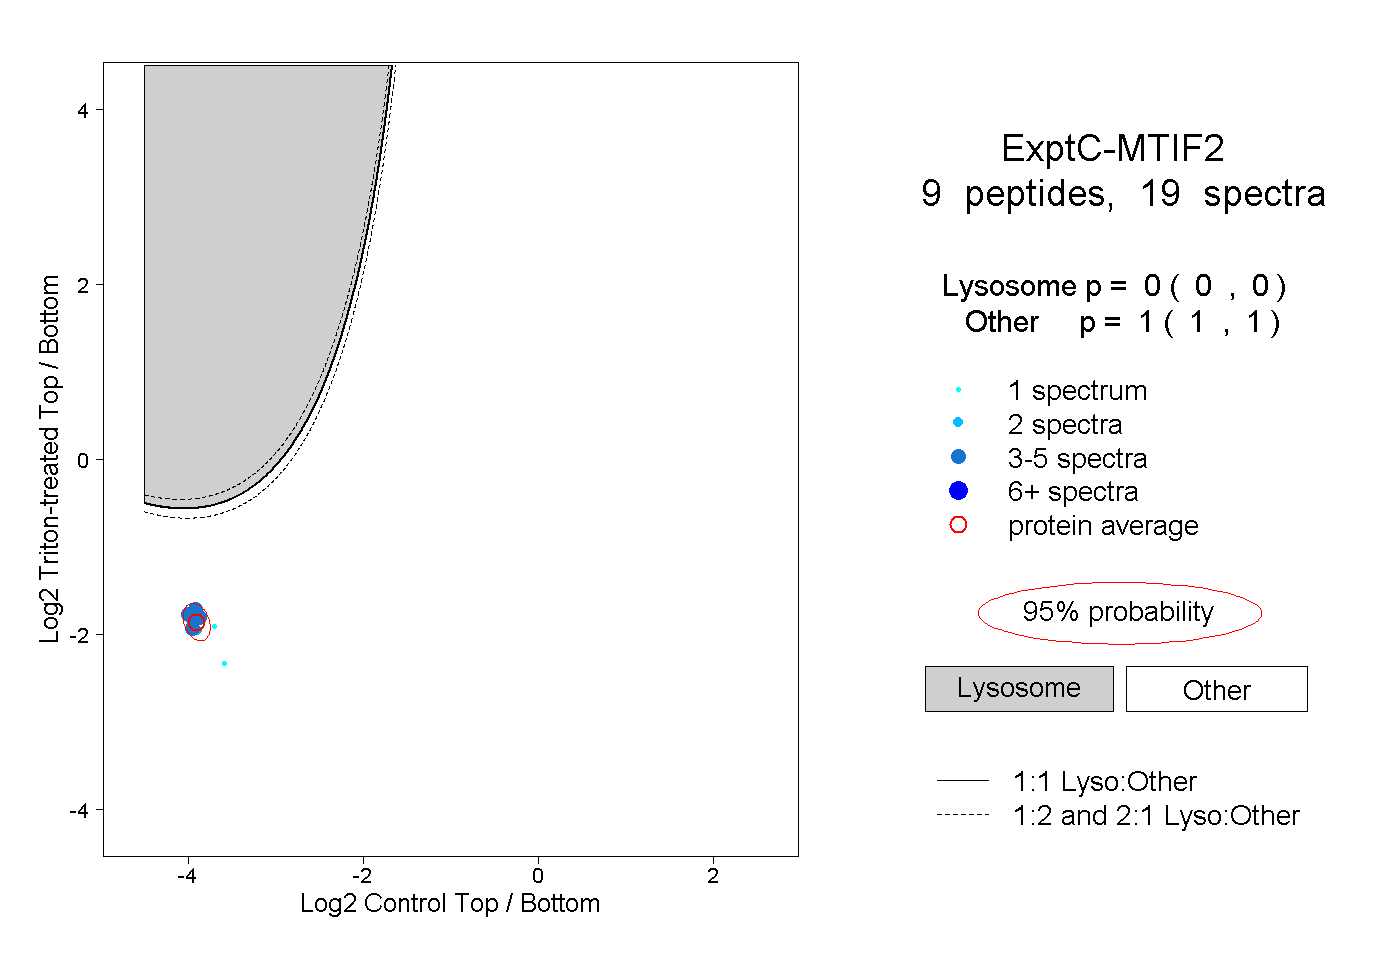
0.000 | 0.000
1.000 | 1.000
4peptides
spectra
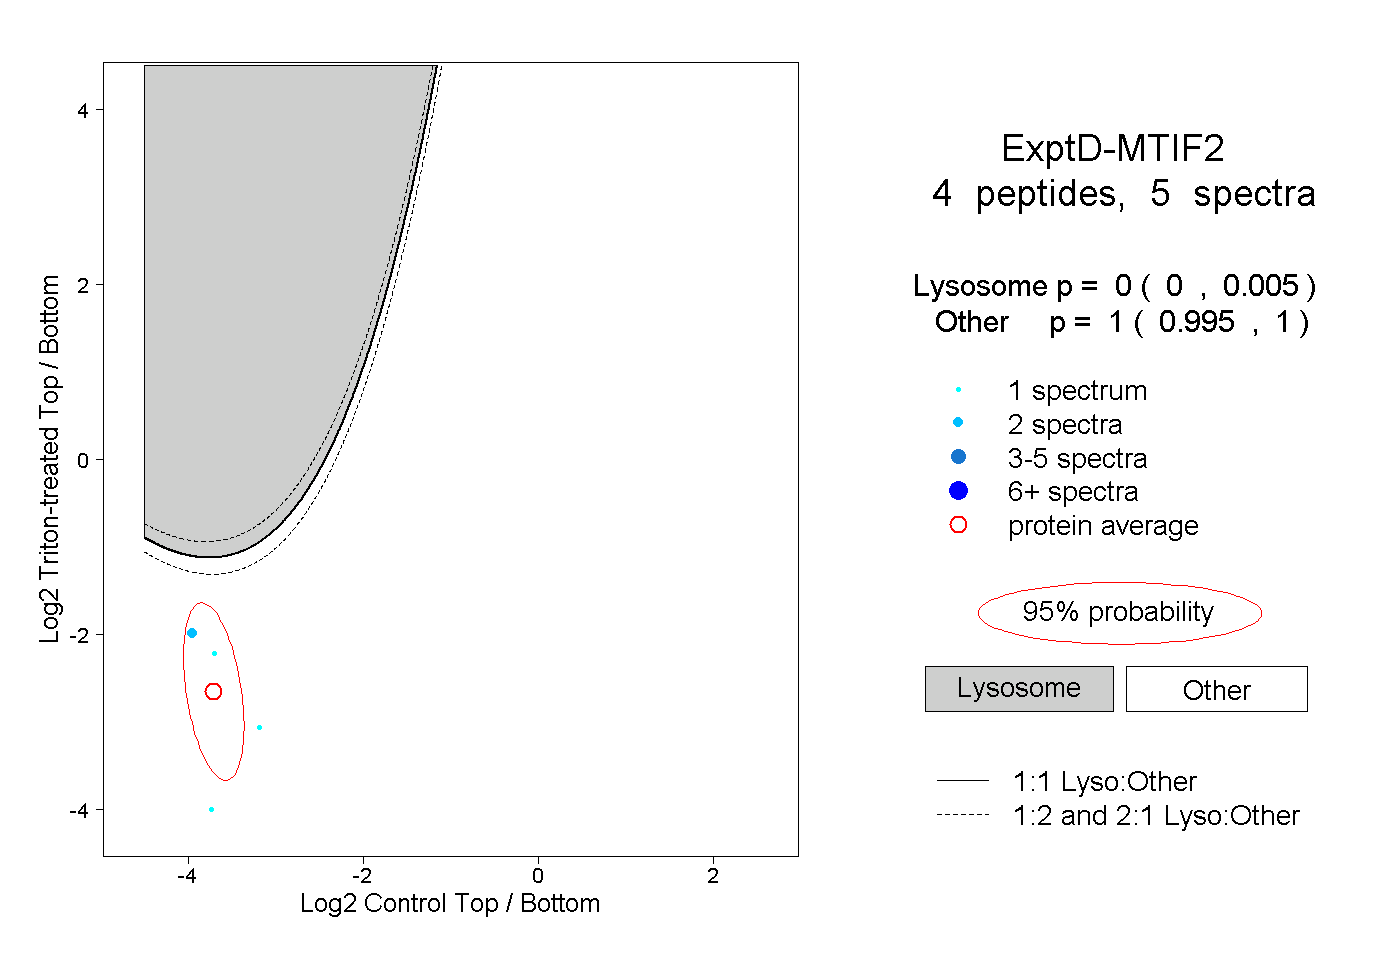
0.000 | 0.005
0.995 | 1.000