 9
9peptides
spectra
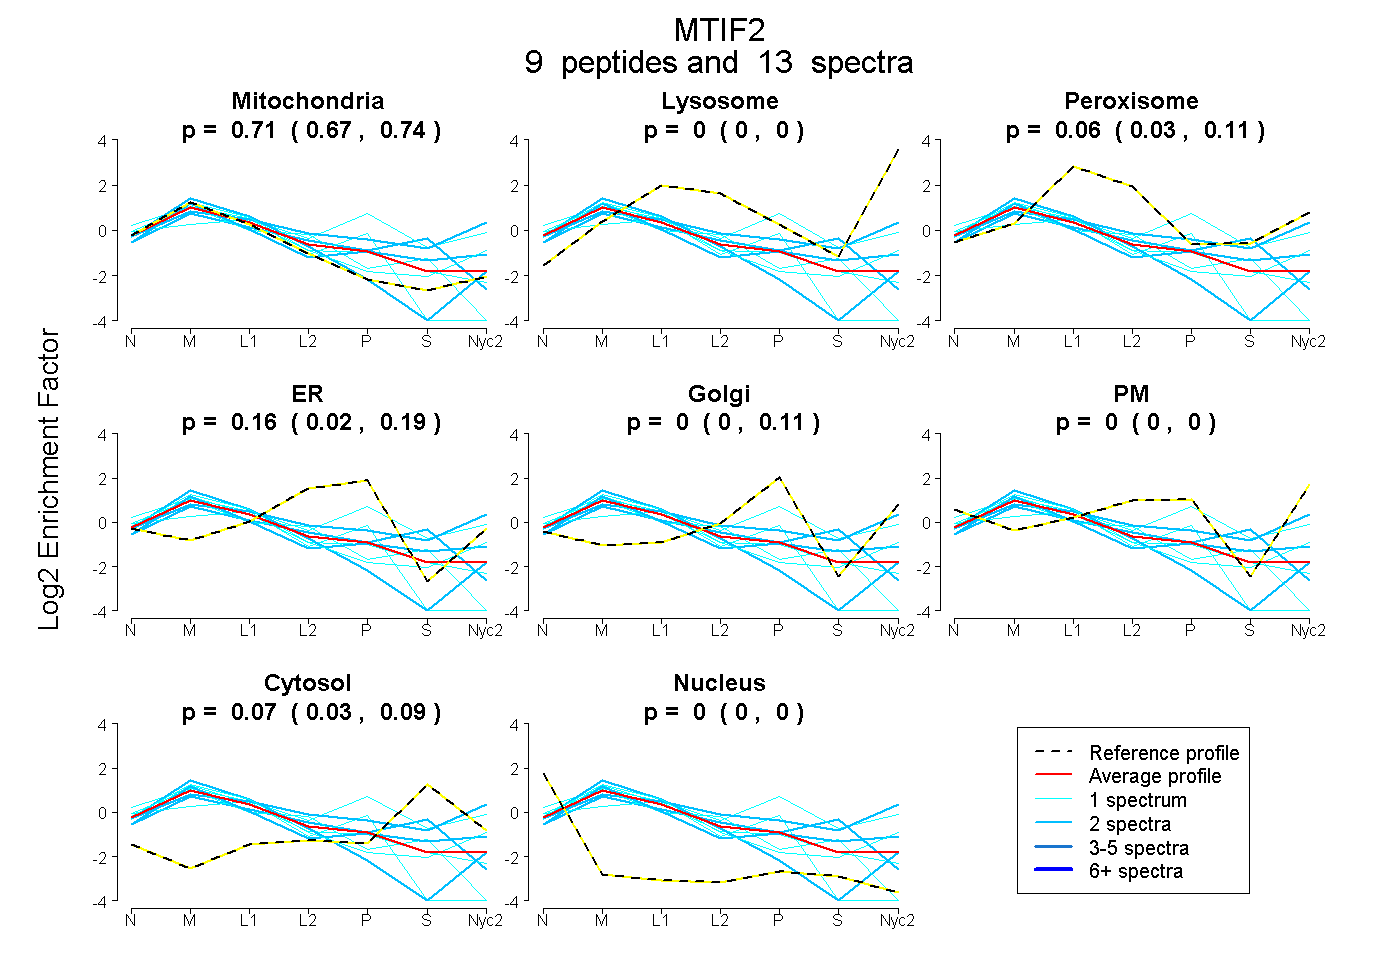
0.668 | 0.741
0.000 | 0.000
0.026 | 0.110
0.021 | 0.185
0.000 | 0.107
0.000 | 0.000
0.030 | 0.093
0.000 | 0.000
| Plot | Mito | Lyso | Perox | ER | Golgi | PM | Cytosol | Nucleus | |||||
| Expt A |
9 peptides |
13 spectra |
|
0.707 0.668 | 0.741 |
0.000 0.000 | 0.000 |
0.065 0.026 | 0.110 |
0.156 0.021 | 0.185 |
0.001 0.000 | 0.107 |
0.000 0.000 | 0.000 |
0.071 0.030 | 0.093 |
0.000 0.000 | 0.000 |
| 1 spectrum, VPVAGCR | 0.809 | 0.164 | 0.000 | 0.000 | 0.000 | 0.000 | 0.027 | 0.000 | ||
| 1 spectrum, TGVDCGLSLDEENVEFK | 0.861 | 0.000 | 0.000 | 0.000 | 0.000 | 0.000 | 0.109 | 0.030 | ||
| 1 spectrum, DLPSAGDEILEVQSEPR | 0.181 | 0.000 | 0.292 | 0.000 | 0.408 | 0.000 | 0.119 | 0.000 | ||
| 2 spectra, LMFDENGK | 0.347 | 0.225 | 0.110 | 0.000 | 0.025 | 0.143 | 0.150 | 0.000 | ||
| 2 spectra, GPVTTAIIQR | 0.970 | 0.000 | 0.000 | 0.005 | 0.000 | 0.026 | 0.000 | 0.000 | ||
| 1 spectrum, GAQVTDIVVLVVAADDGVMK | 0.803 | 0.000 | 0.011 | 0.124 | 0.000 | 0.000 | 0.062 | 0.000 | ||
| 2 spectra, ADPTGPVEGTVIESFTDK | 0.582 | 0.000 | 0.097 | 0.038 | 0.000 | 0.000 | 0.284 | 0.000 | ||
| 2 spectra, TSWDPGF | 0.665 | 0.098 | 0.000 | 0.000 | 0.092 | 0.000 | 0.146 | 0.000 | ||
| 1 spectrum, DSNVLPIIIK | 0.736 | 0.000 | 0.000 | 0.169 | 0.000 | 0.000 | 0.000 | 0.095 |
| Plot | Mito | Lyso or Perox | ER | Golgi | PM | Cytosol | Nucleus | ||||||
| Expt B |
1 peptide |
2 spectra |
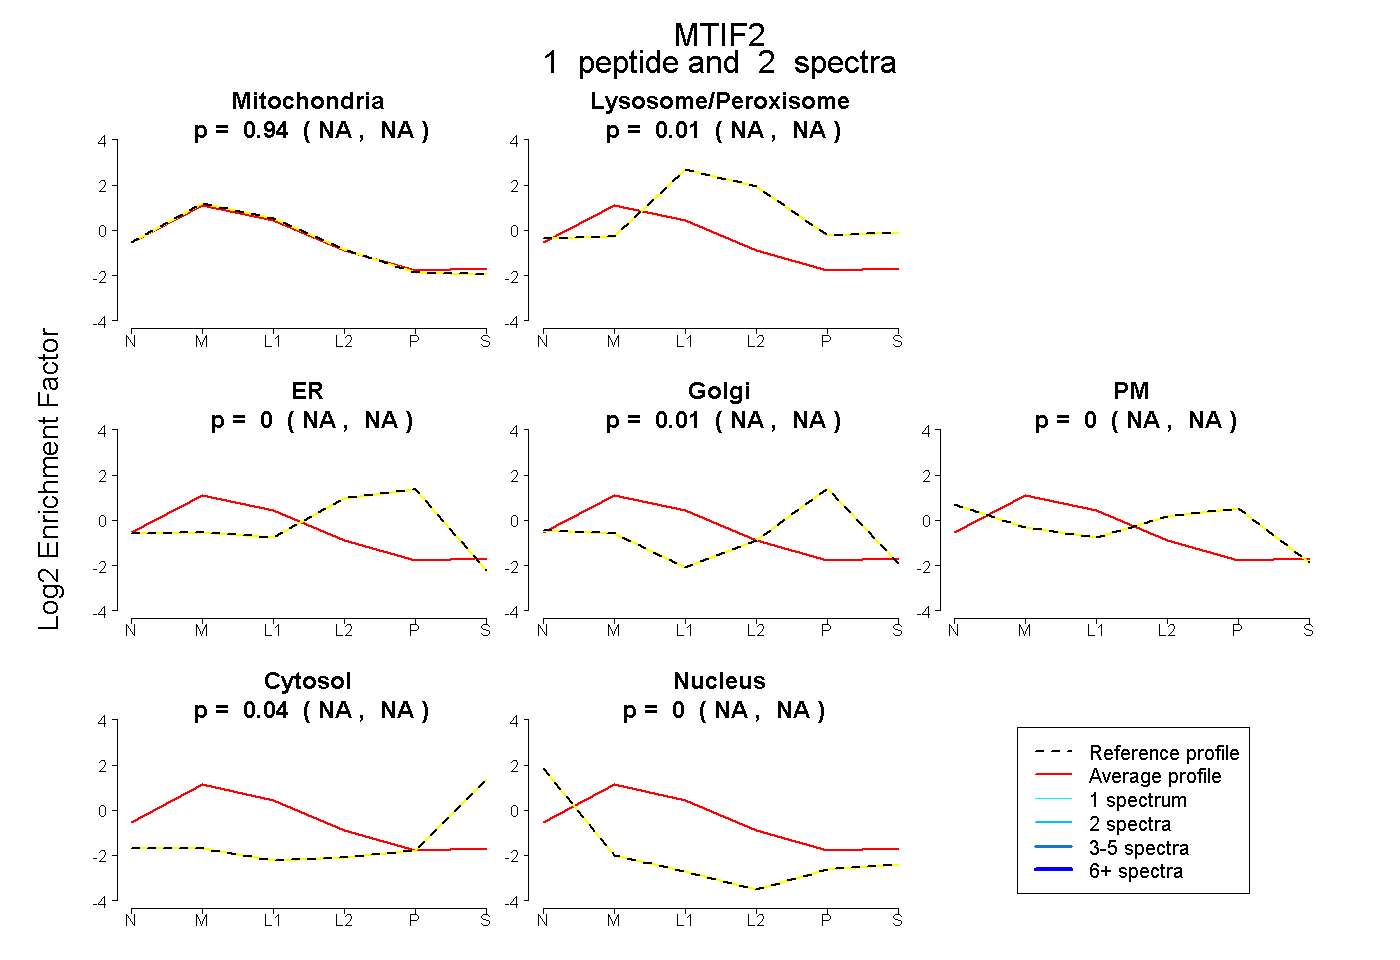 |
0.936 NA | NA |
0.011 NA | NA |
0.000 NA | NA |
0.009 NA | NA |
0.002 NA | NA |
0.042 NA | NA |
0.000 NA | NA |
|||
| Plot | Lyso | Other | |||||||||||
| Expt C |
9 peptides |
19 spectra |
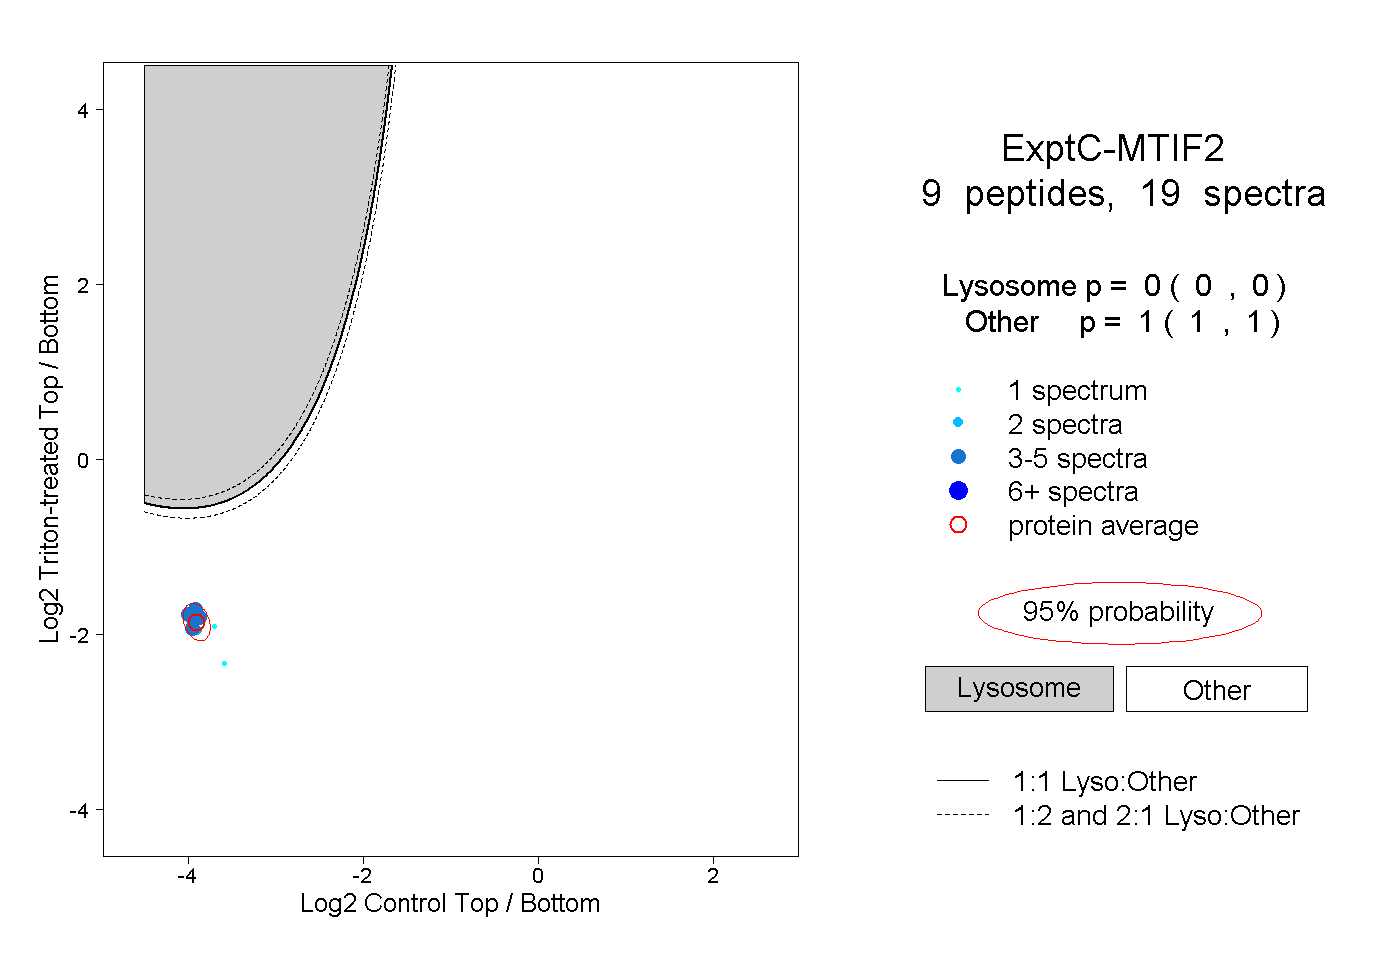 |
0.000 0.000 | 0.000 |
1.000 1.000 | 1.000 |
||||||||
| Plot | Lyso | Other | |||||||||||
| Expt D |
4 peptides |
5 spectra |
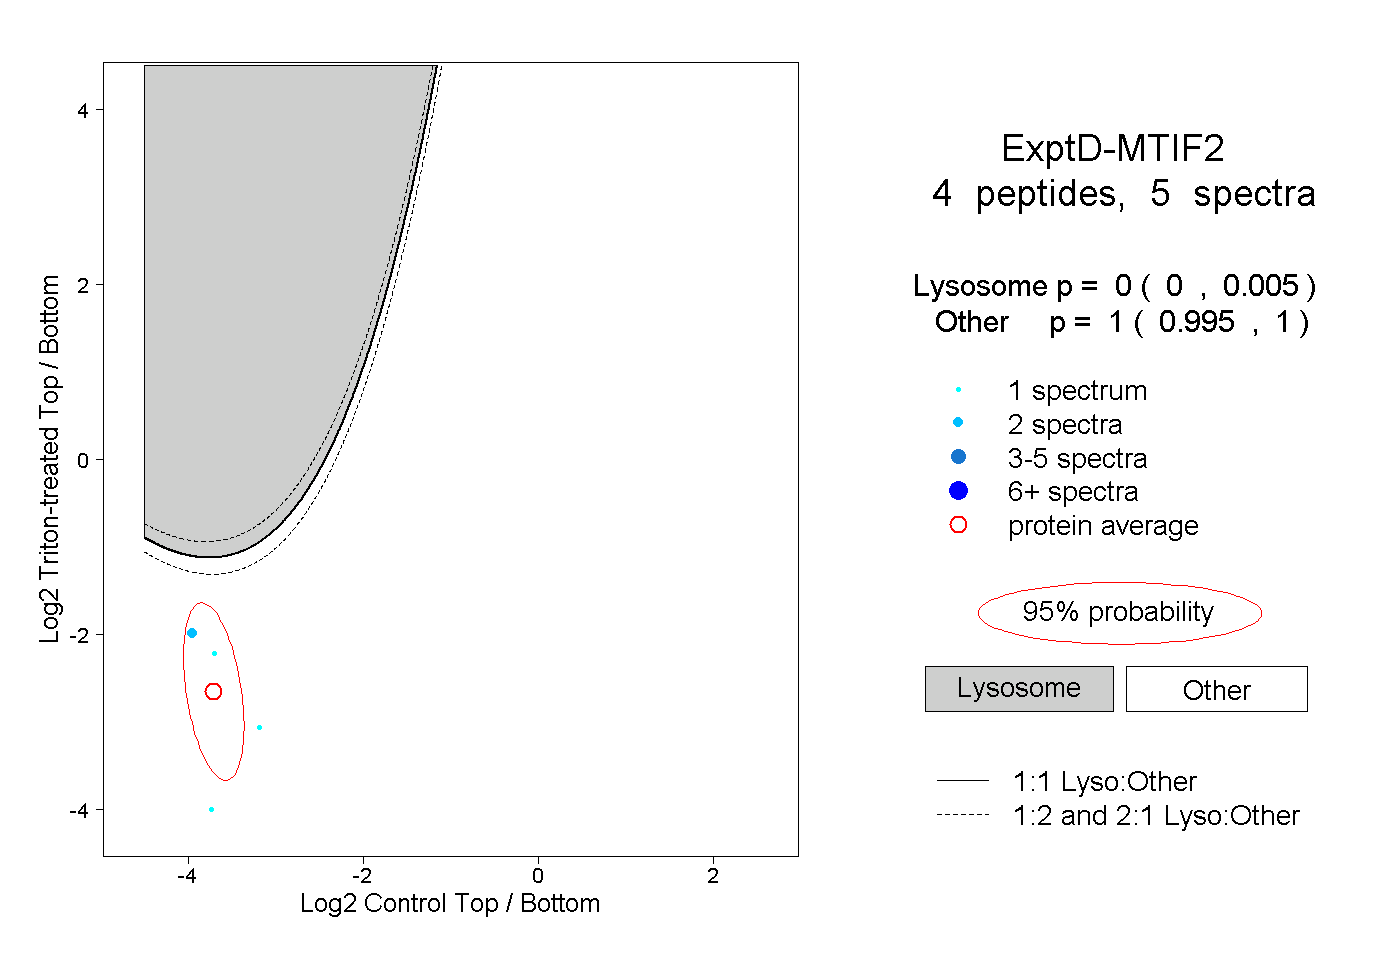 |
0.000 0.000 | 0.005 |
1.000 0.995 | 1.000 |