 15
15peptides
spectra
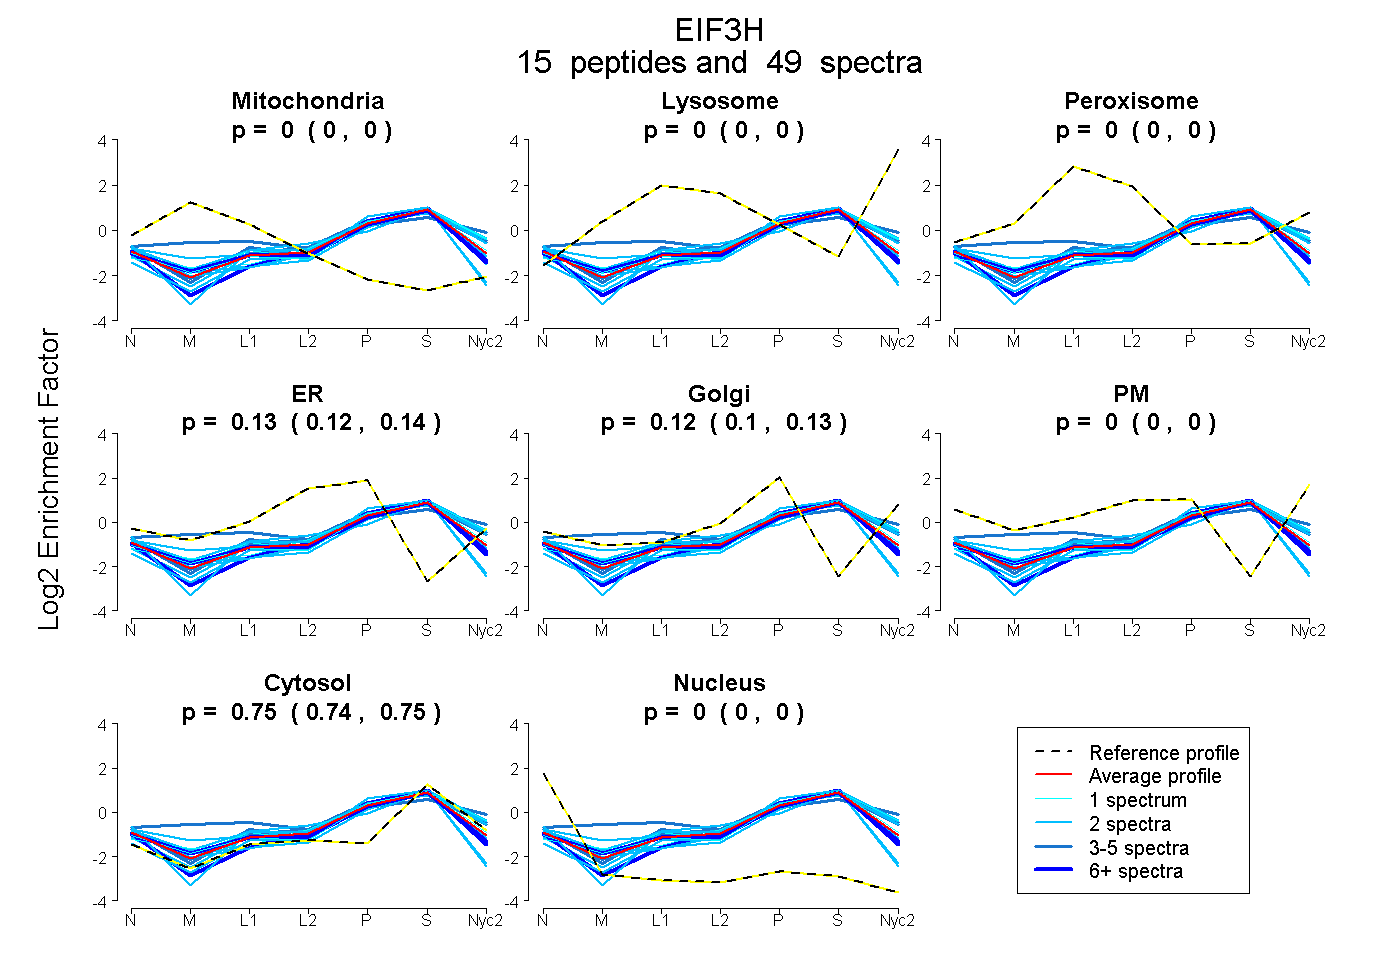
0.000 | 0.000
0.000 | 0.000
0.000 | 0.000
0.118 | 0.144
0.104 | 0.135
0.000 | 0.000
0.743 | 0.751
0.000 | 0.000
5peptides
spectra
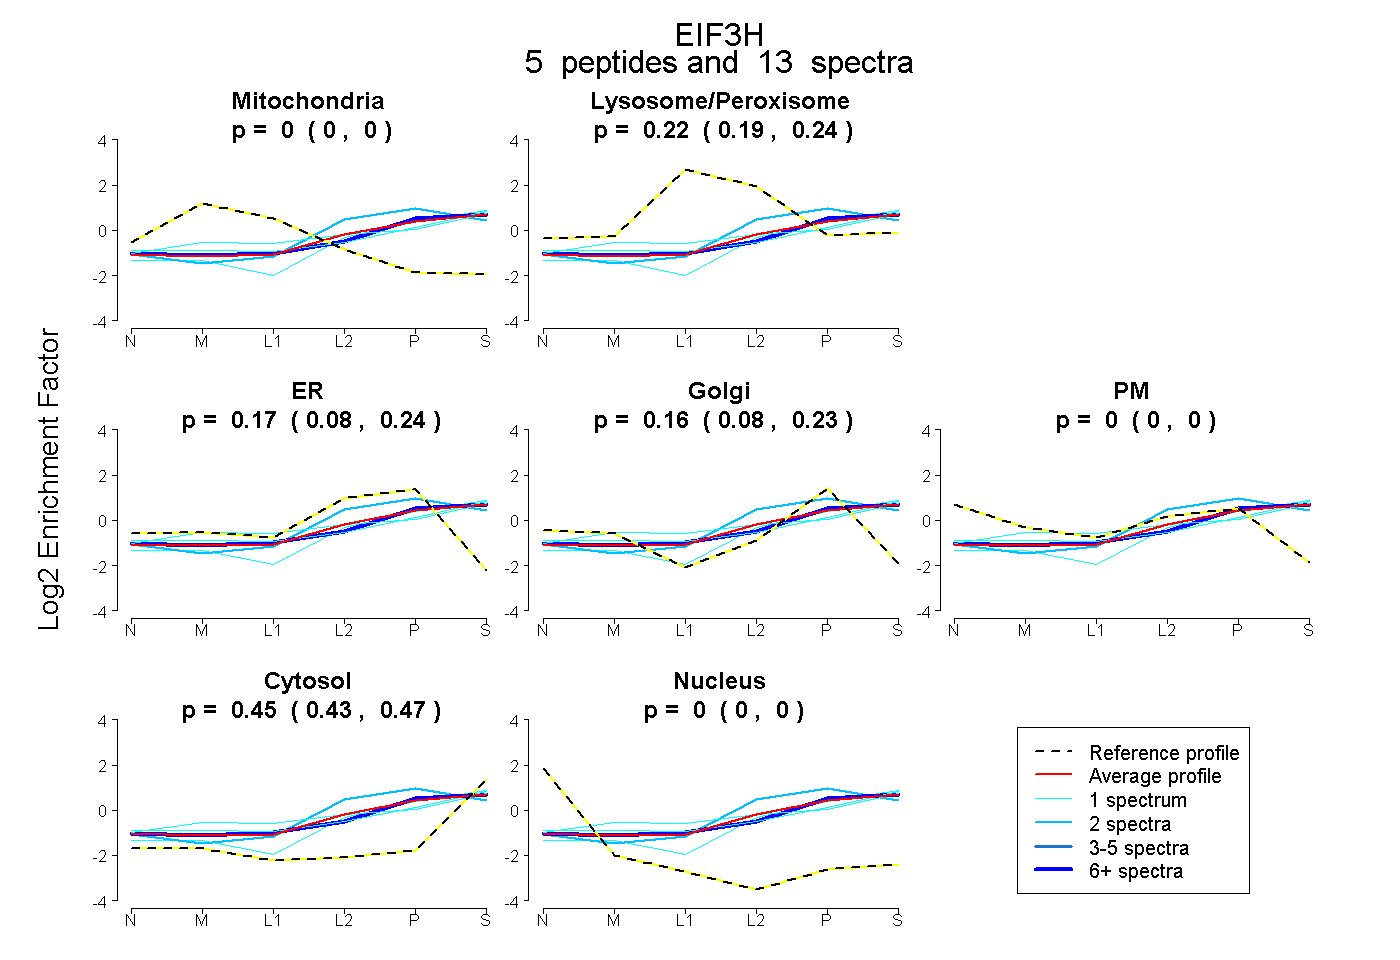
0.000 | 0.000
0.193 | 0.242
0.083 | 0.239
0.082 | 0.227
0.000 | 0.000
0.428 | 0.467
0.000 | 0.000
8peptides
spectra
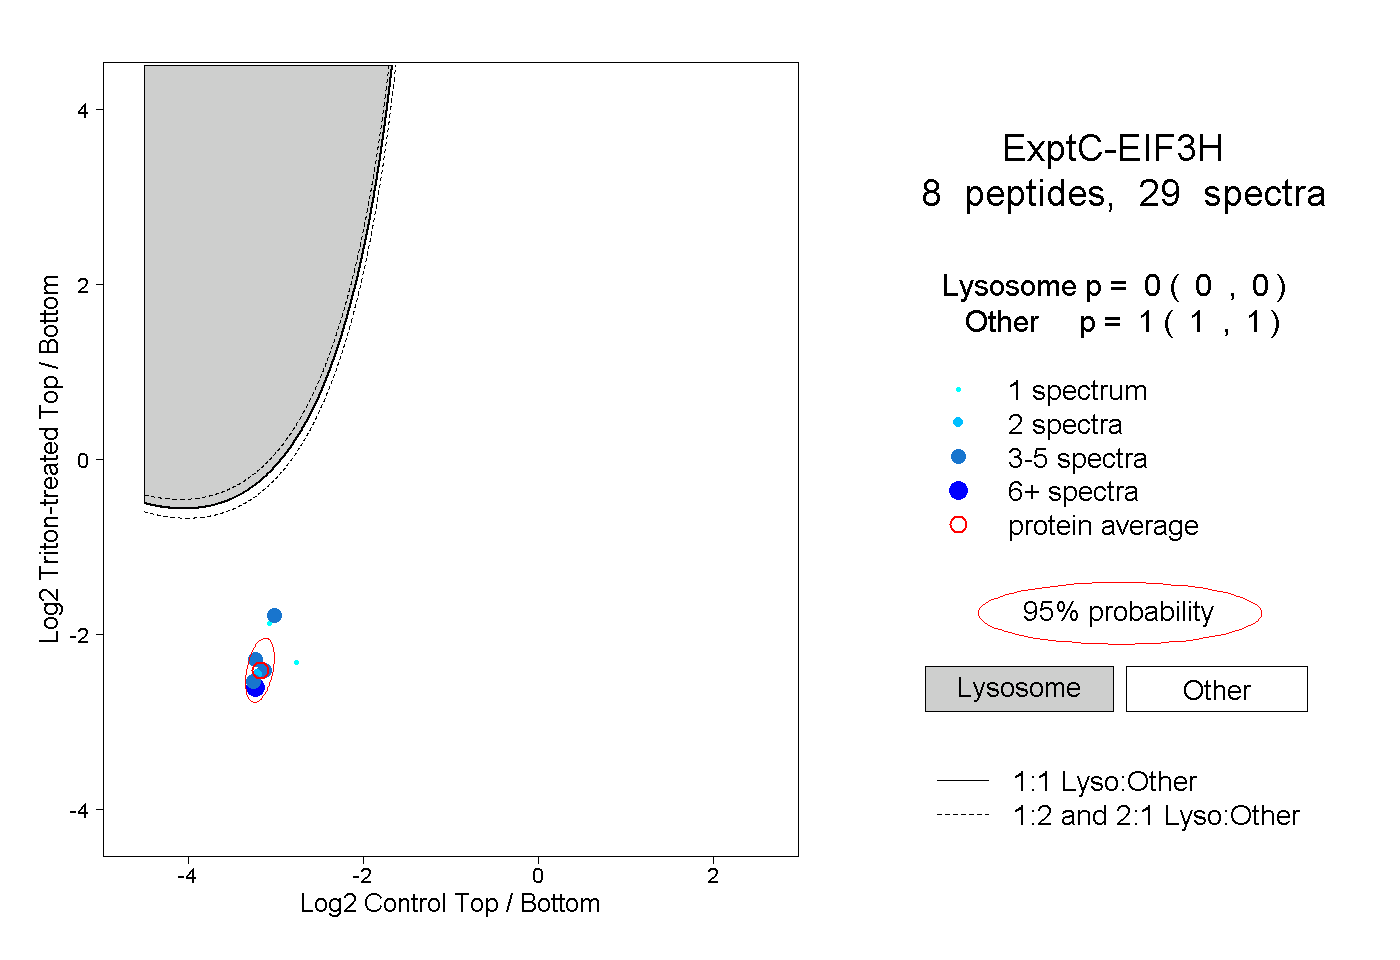
0.000 | 0.000
1.000 | 1.000
1peptide
spectra
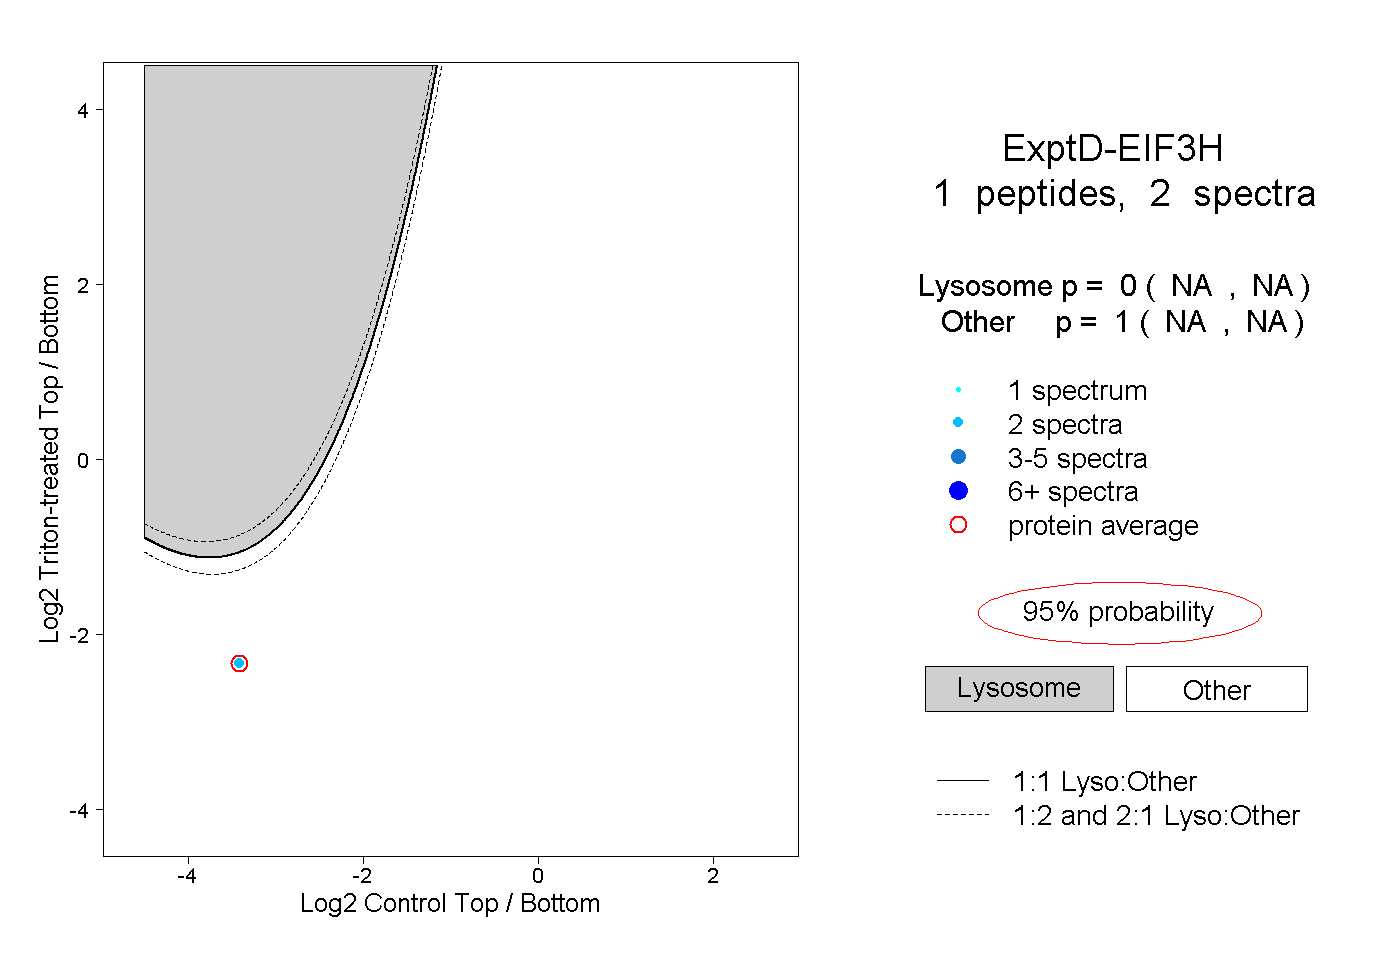
NA | NA
NA | NA