 15
15peptides
spectra
0.000 | 0.000
0.000 | 0.000
0.000 | 0.000
0.118 | 0.144
0.104 | 0.135
0.000 | 0.000
0.743 | 0.751
0.000 | 0.000
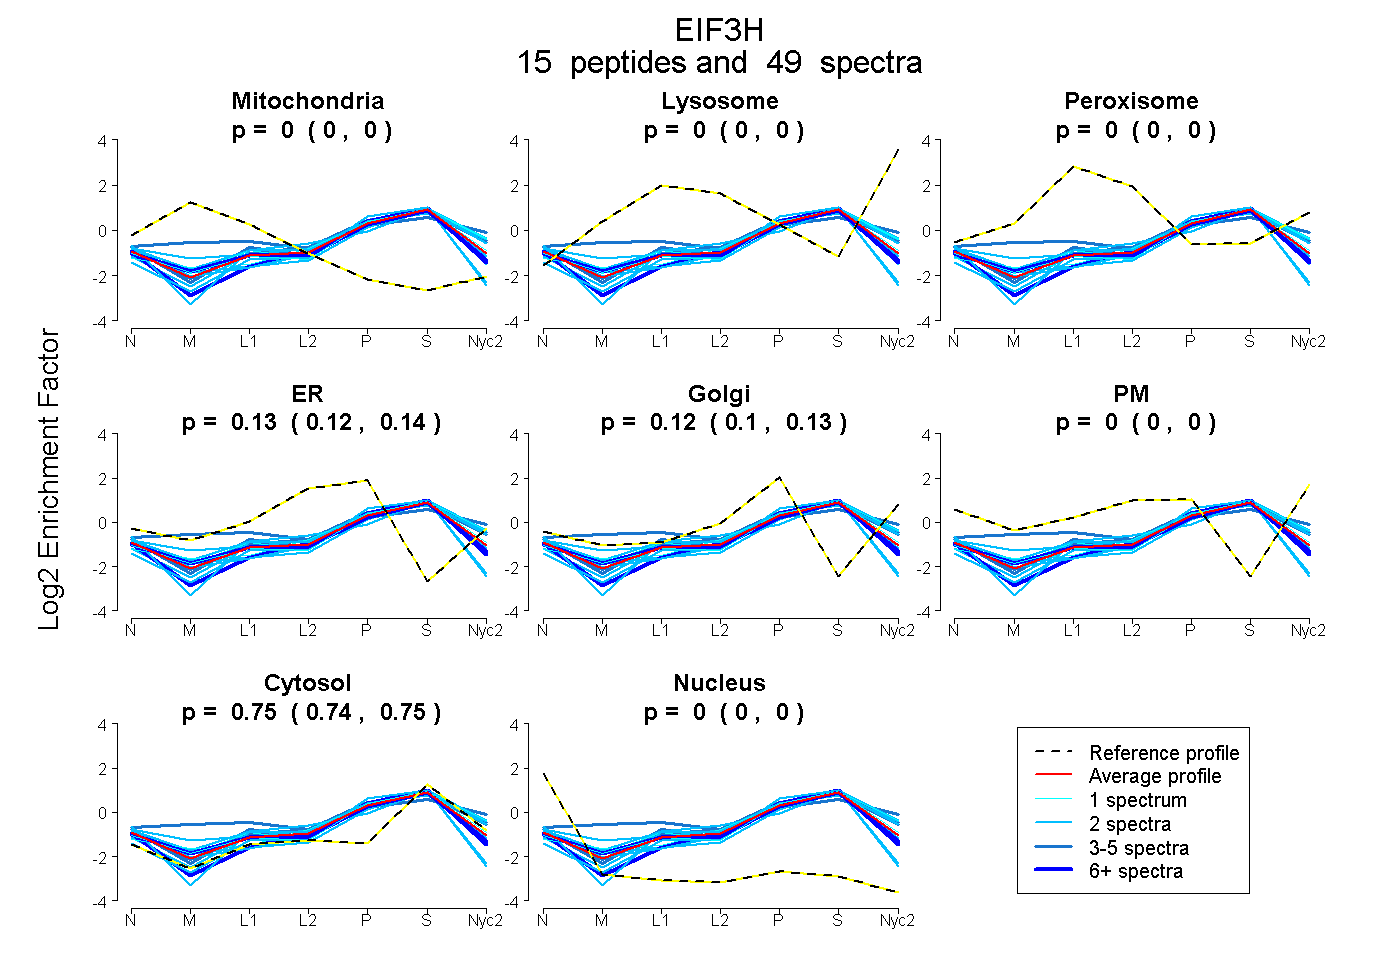
| Plot | Mito | Lyso | Perox | ER | Golgi | PM | Cytosol | Nucleus | |||||
| Expt A |
15 peptides |
49 spectra |
|
0.000 0.000 | 0.000 |
0.000 0.000 | 0.000 |
0.000 0.000 | 0.000 |
0.132 0.118 | 0.144 |
0.121 0.104 | 0.135 |
0.000 0.000 | 0.000 |
0.747 0.743 | 0.751 |
0.000 0.000 | 0.000 |
| 4 spectra, GEPPLPEEDLSK | 0.000 | 0.000 | 0.000 | 0.096 | 0.218 | 0.000 | 0.687 | 0.000 | ||
| 8 spectra, VDEMSQDIIK | 0.000 | 0.000 | 0.000 | 0.173 | 0.060 | 0.000 | 0.767 | 0.000 | ||
| 3 spectra, GGSGDSAVK | 0.000 | 0.000 | 0.025 | 0.000 | 0.261 | 0.000 | 0.715 | 0.000 | ||
| 3 spectra, DFSPEALK | 0.039 | 0.021 | 0.176 | 0.000 | 0.259 | 0.000 | 0.504 | 0.000 | ||
| 1 spectrum, NLQLLMDR | 0.000 | 0.003 | 0.000 | 0.000 | 0.301 | 0.000 | 0.696 | 0.000 | ||
| 2 spectra, QVQIDGLVVLK | 0.000 | 0.000 | 0.000 | 0.166 | 0.000 | 0.000 | 0.759 | 0.075 | ||
| 2 spectra, ANITFEHMFEEVPIVIK | 0.000 | 0.000 | 0.000 | 0.186 | 0.000 | 0.000 | 0.771 | 0.044 | ||
| 2 spectra, LMEVCK | 0.000 | 0.000 | 0.062 | 0.000 | 0.317 | 0.000 | 0.621 | 0.000 | ||
| 2 spectra, EFTAQNLGK | 0.000 | 0.000 | 0.000 | 0.058 | 0.125 | 0.000 | 0.781 | 0.036 | ||
| 14 spectra, LFKPHQAPAR | 0.000 | 0.000 | 0.000 | 0.122 | 0.064 | 0.000 | 0.798 | 0.017 | ||
| 1 spectrum, NSHLINVLMWELEK | 0.000 | 0.000 | 0.015 | 0.000 | 0.283 | 0.000 | 0.702 | 0.000 | ||
| 2 spectra, TAQGSLSLK | 0.000 | 0.000 | 0.000 | 0.000 | 0.278 | 0.000 | 0.722 | 0.000 | ||
| 1 spectrum, YNTYMR | 0.000 | 0.000 | 0.000 | 0.000 | 0.267 | 0.000 | 0.733 | 0.000 | ||
| 2 spectra, QQENMQR | 0.000 | 0.000 | 0.000 | 0.008 | 0.208 | 0.000 | 0.784 | 0.000 | ||
| 2 spectra, LFMAQALQEYSN | 0.000 | 0.000 | 0.116 | 0.000 | 0.199 | 0.000 | 0.685 | 0.000 |
| Plot | Mito | Lyso or Perox | ER | Golgi | PM | Cytosol | Nucleus | ||||||
| Expt B |
5 peptides |
13 spectra |
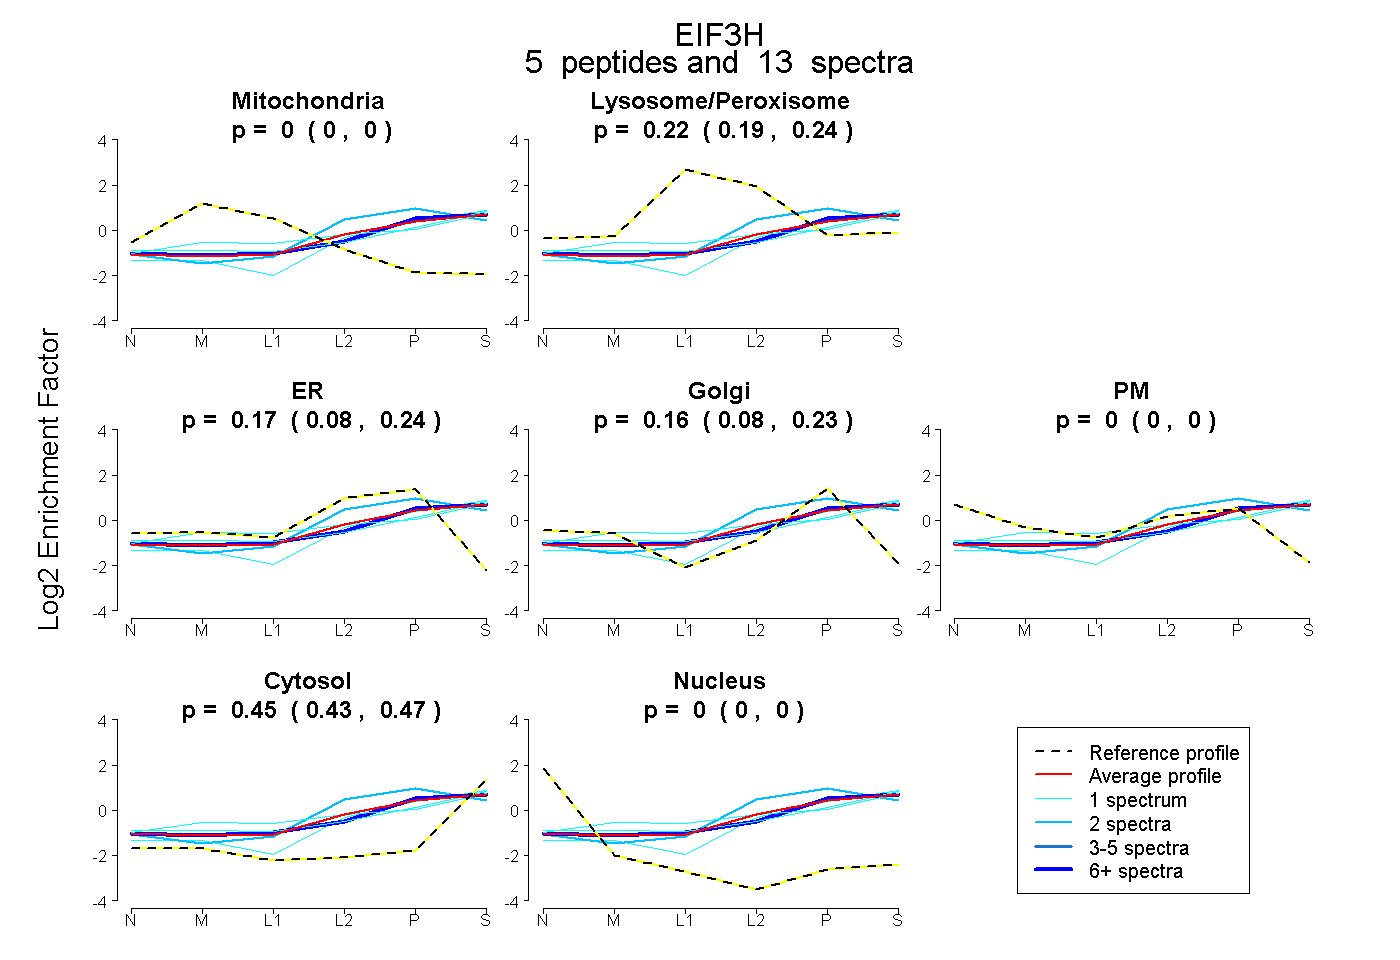 |
0.000 0.000 | 0.000 |
0.220 0.193 | 0.242 |
0.171 0.083 | 0.239 |
0.160 0.082 | 0.227 |
0.000 0.000 | 0.000 |
0.449 0.428 | 0.467 |
0.000 0.000 | 0.000 |
|||
| Plot | Lyso | Other | |||||||||||
| Expt C |
8 peptides |
29 spectra |
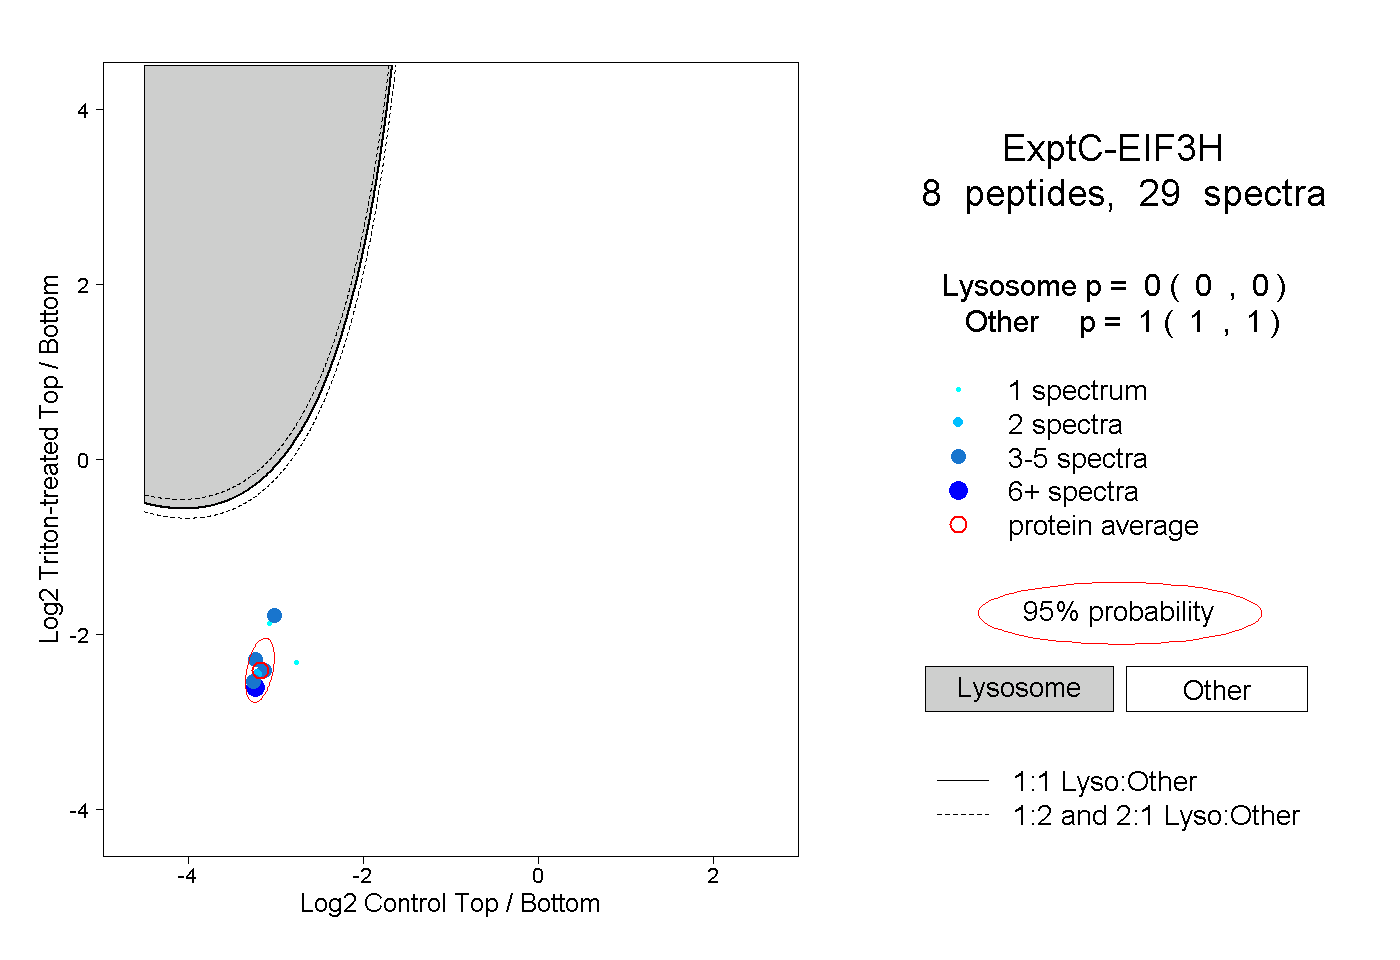 |
0.000 0.000 | 0.000 |
1.000 1.000 | 1.000 |
||||||||
| Plot | Lyso | Other | |||||||||||
| Expt D |
1 peptide |
2 spectra |
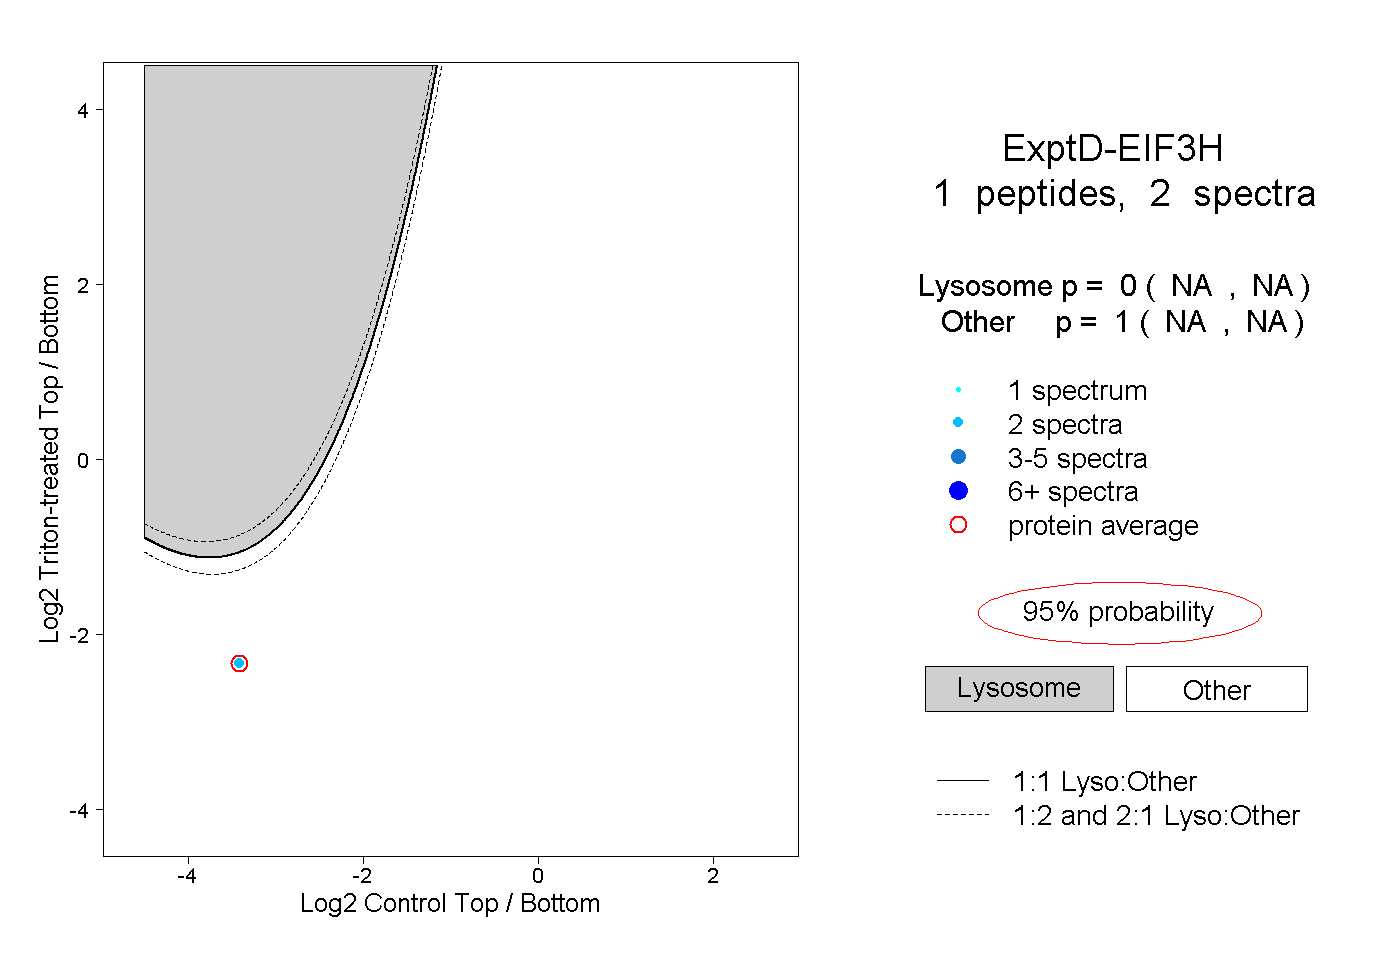 |
0.000 NA | NA |
1.000 NA | NA |