 4
4peptides
spectra
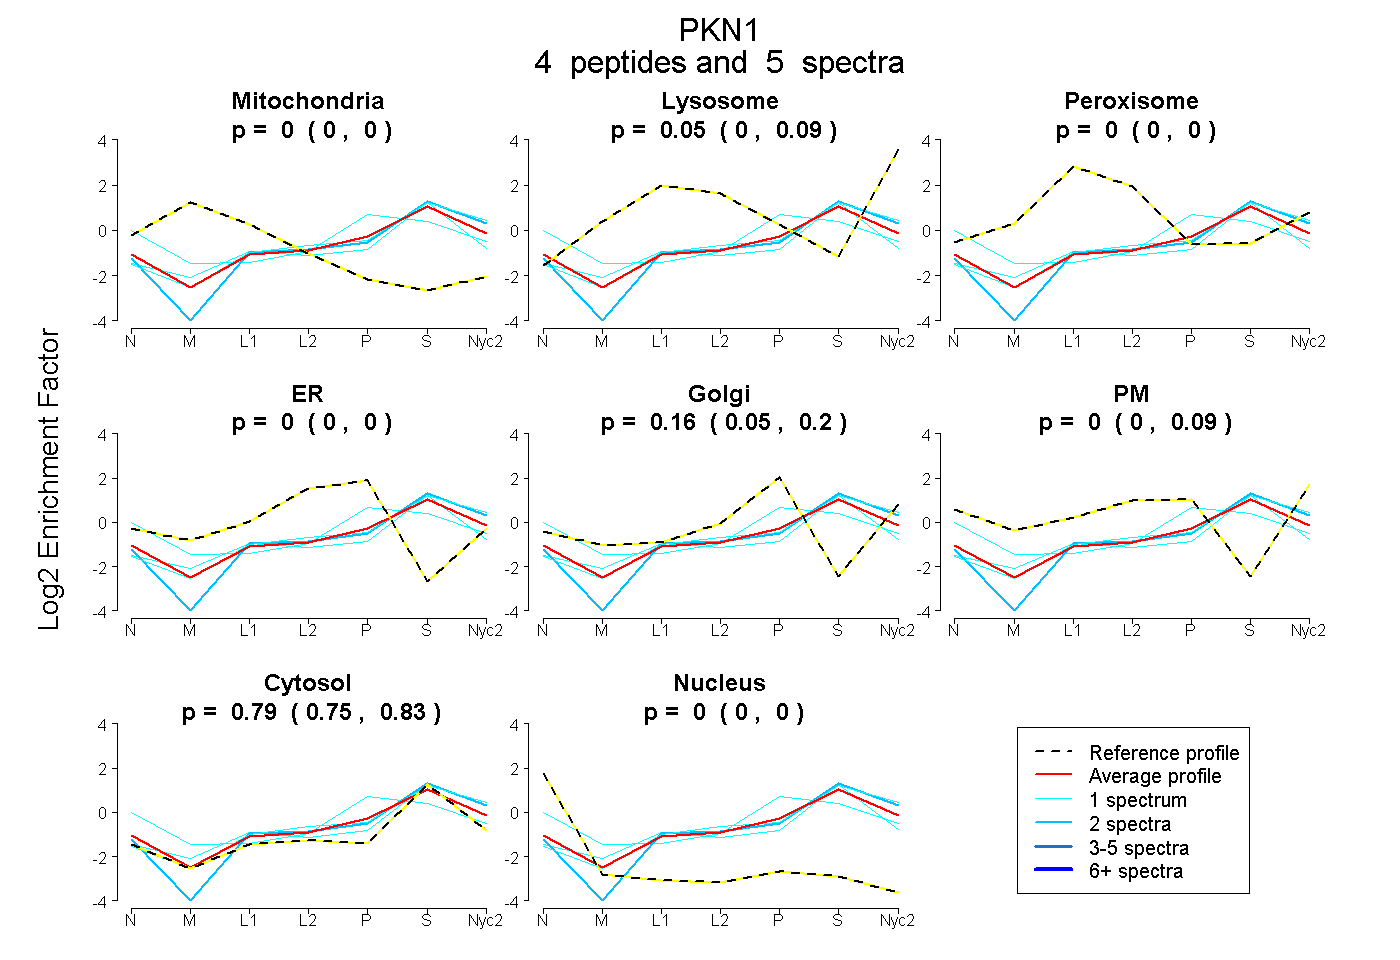
0.000 | 0.000
0.000 | 0.086
0.000 | 0.004
0.000 | 0.000
0.048 | 0.204
0.000 | 0.092
0.748 | 0.830
0.000 | 0.000
1peptide
spectrum
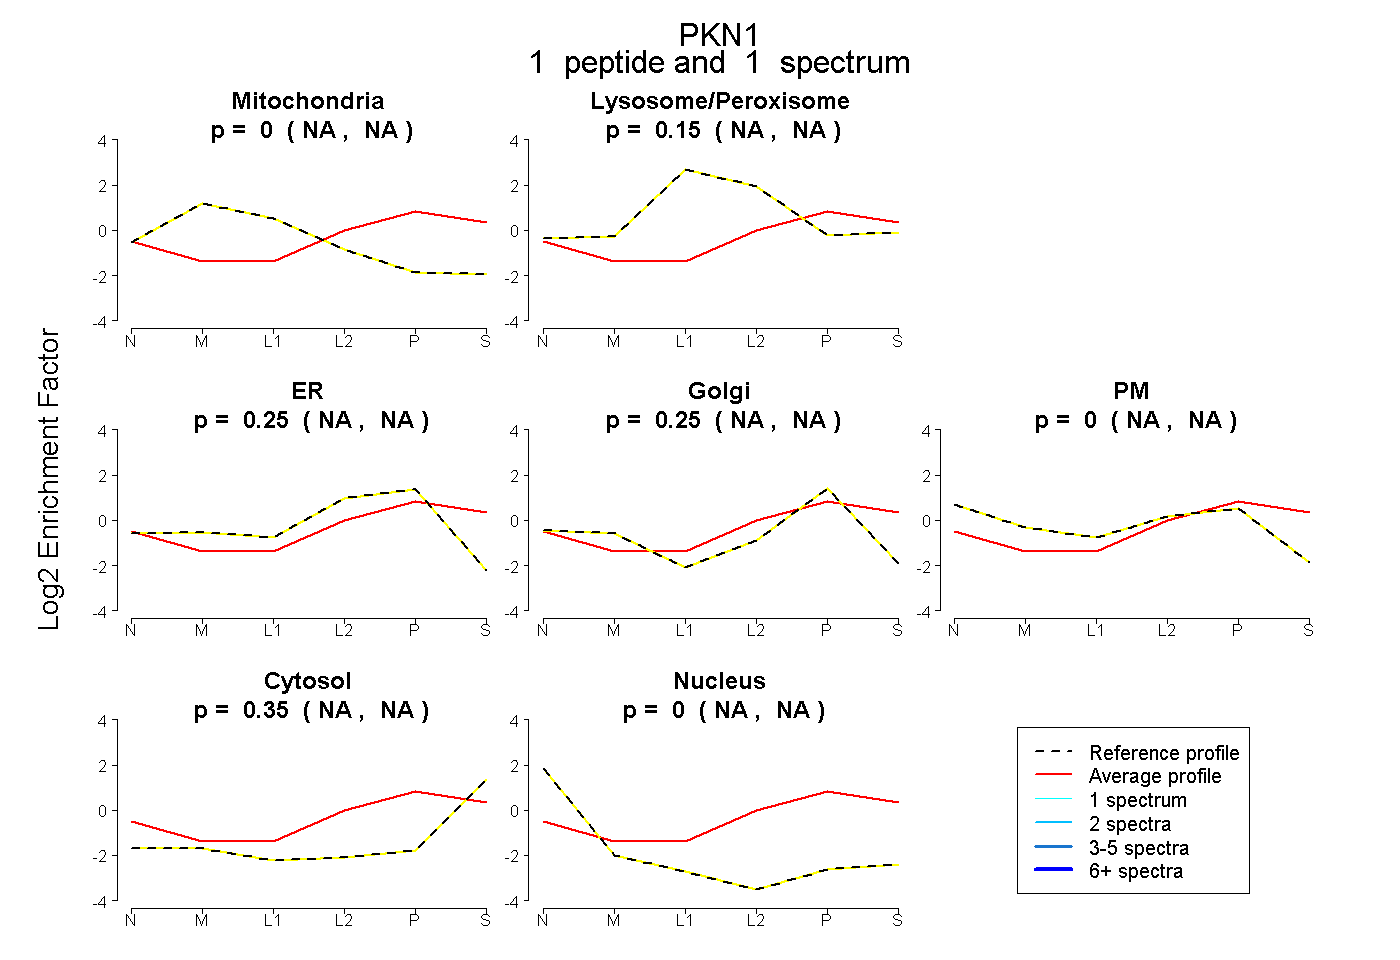
NA | NA
NA | NA
NA | NA
NA | NA
NA | NA
NA | NA
NA | NA
7peptides
spectra
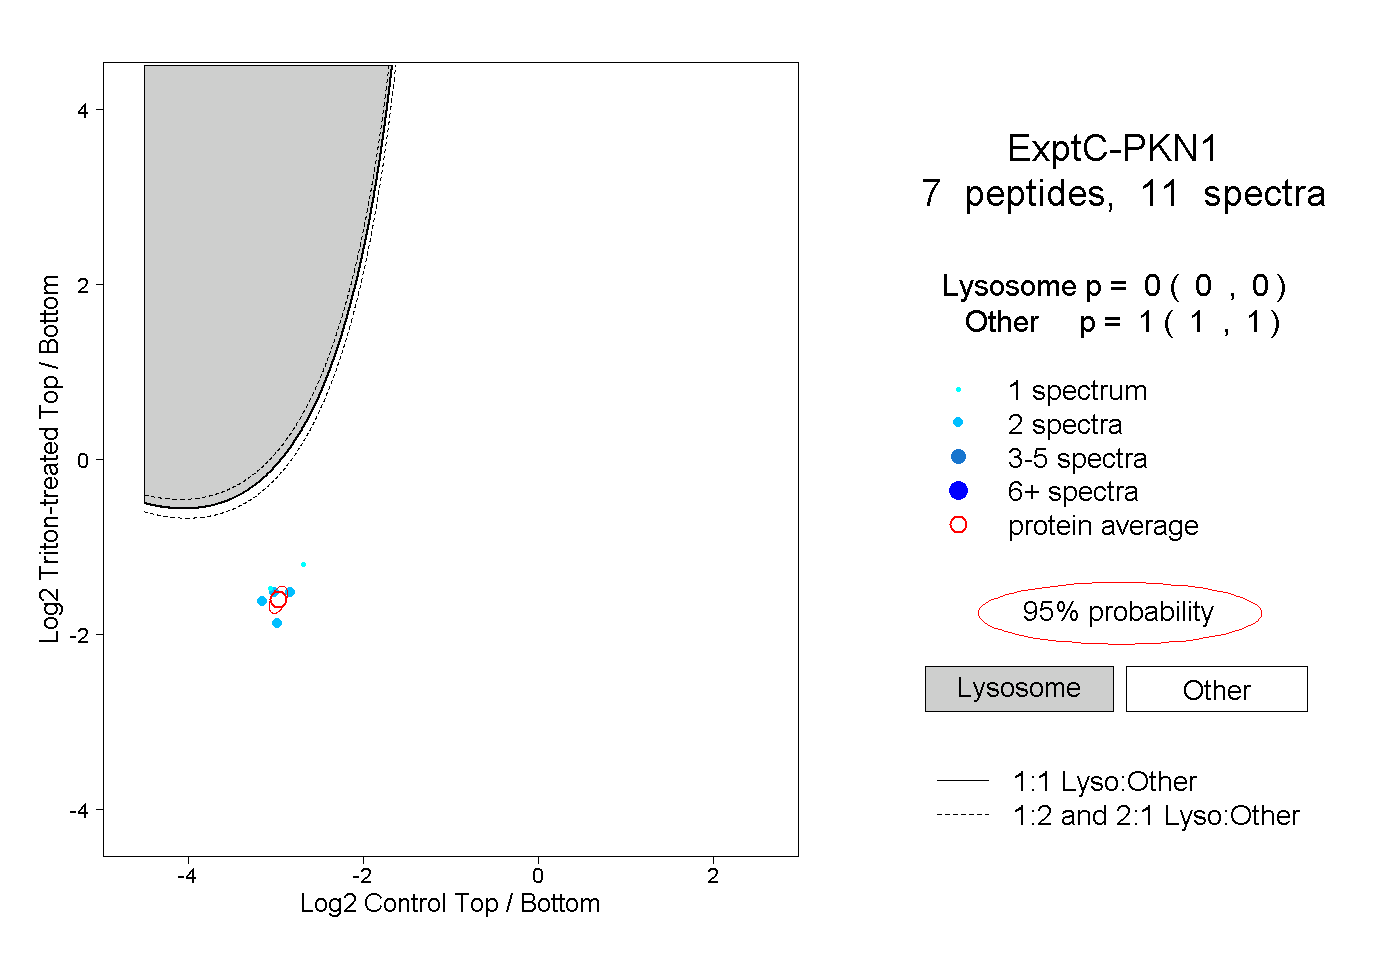
0.000 | 0.000
1.000 | 1.000