PKN1
[ENSRNOP00000005770]
Main page
| | | Plot |
Mito |
Lyso |
|
Perox |
ER |
Golgi |
PM |
Cytosol |
Nucleus |
|
| Expt A |
 4
4
peptides |
5
spectra |
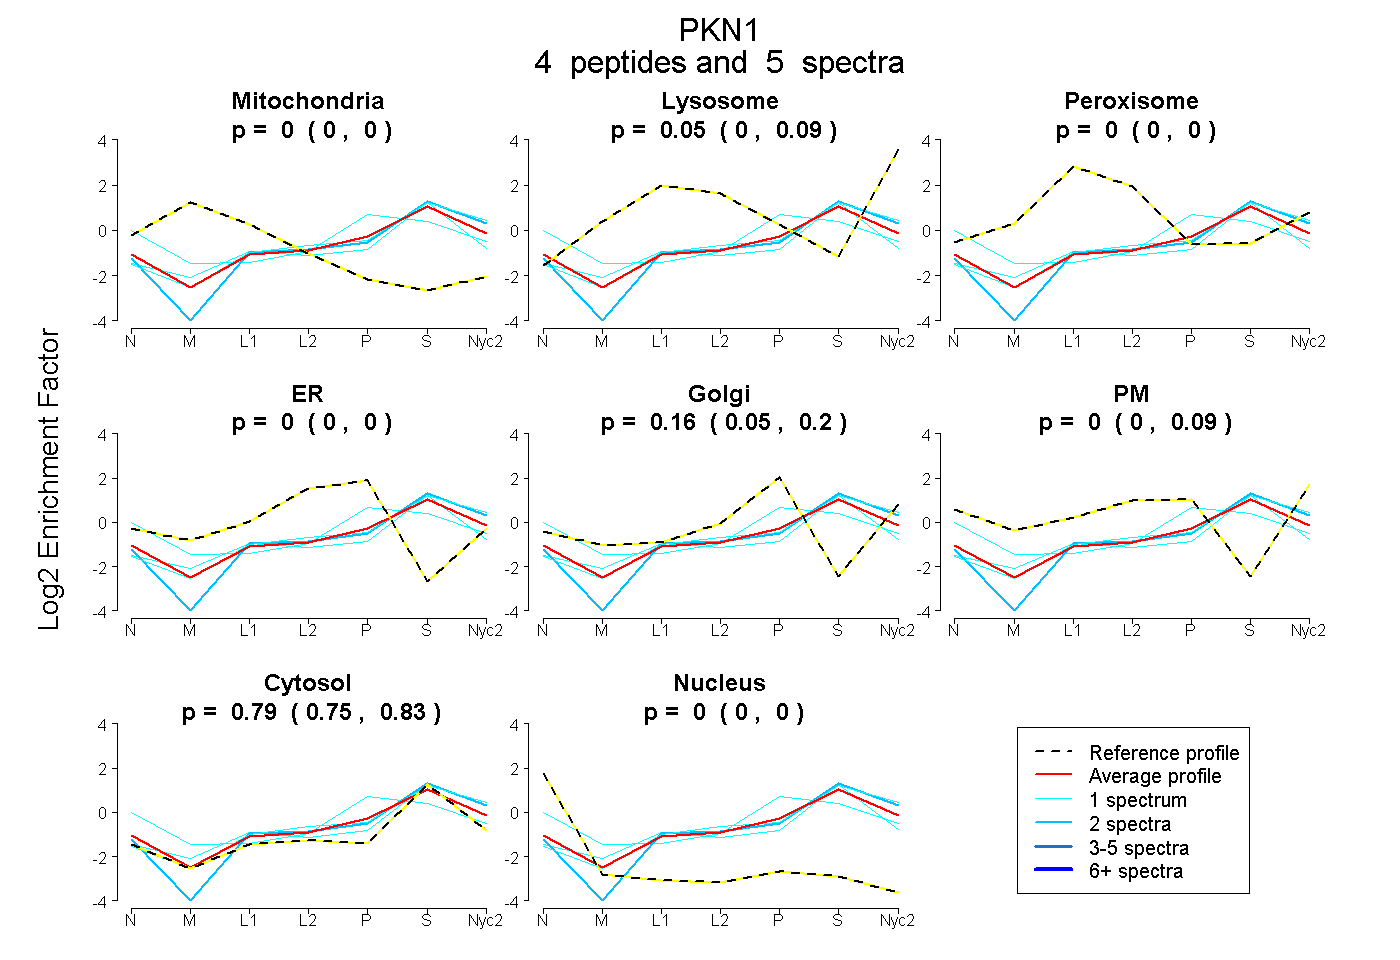 |
0.000
0.000 | 0.000 |
0.051
0.000 | 0.086 |
|
0.000
0.000 | 0.004 |
0.000
0.000 | 0.000 |
0.158
0.048 | 0.204 |
0.000
0.000 | 0.092 |
0.791
0.748 | 0.830 |
0.000
0.000 | 0.000 |
|
| | | Plot |
Mito |
|
Lyso or Perox |
|
ER |
Golgi |
PM |
Cytosol |
Nucleus |
|
| Expt B |
1
peptide |
1
spectrum |
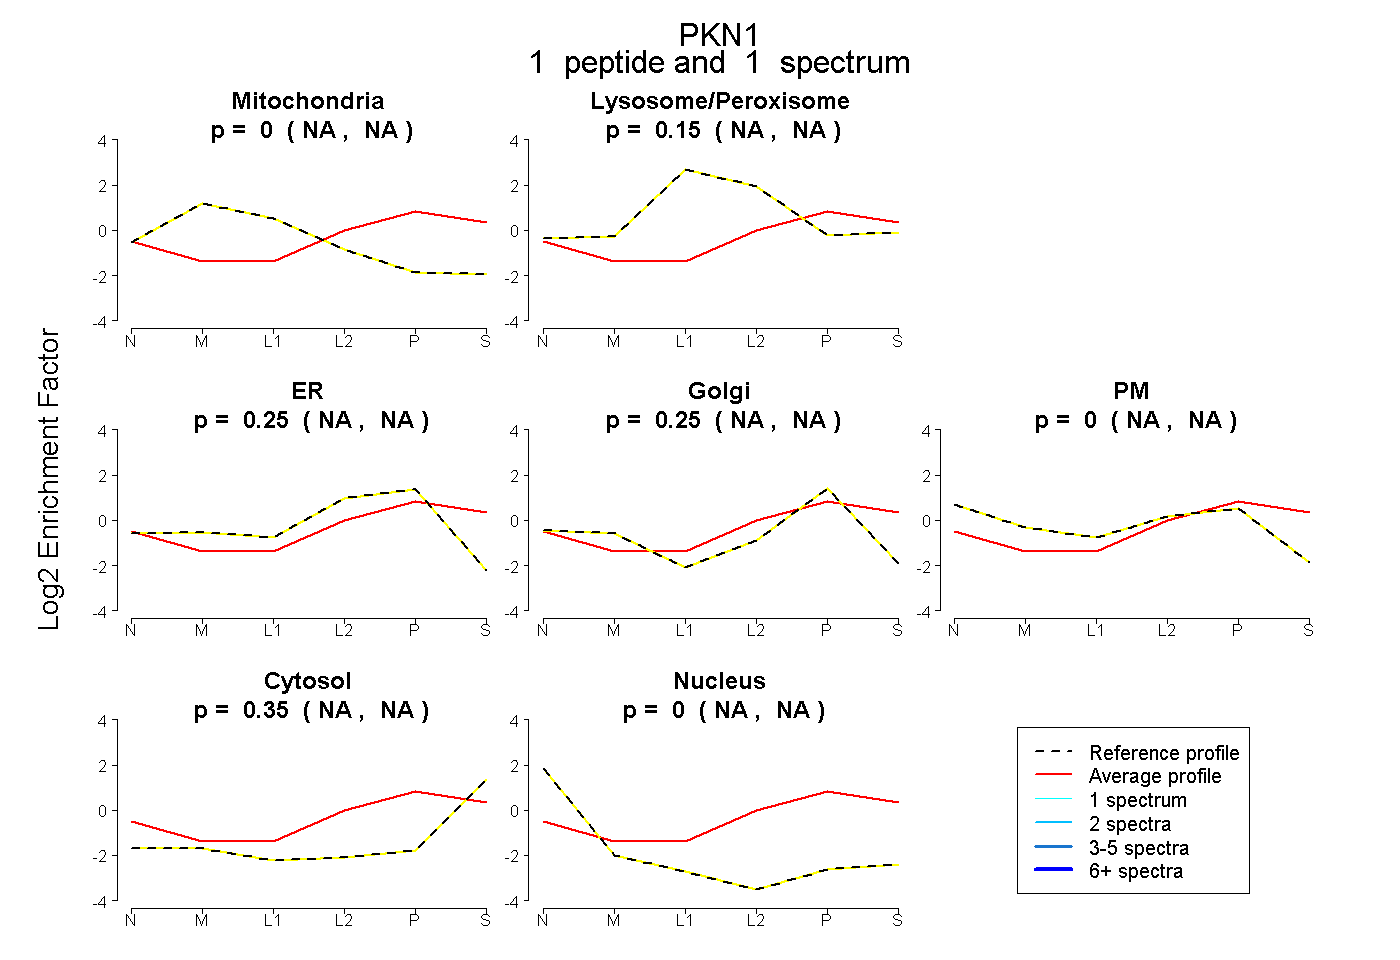 |
0.000
NA | NA |
|
0.149
NA | NA |
|
0.252
NA | NA |
0.247
NA | NA |
0.000
NA | NA |
0.352
NA | NA |
0.000
NA | NA |
|
| | | Plot |
|
Lyso |
|
|
|
|
|
|
|
Other |
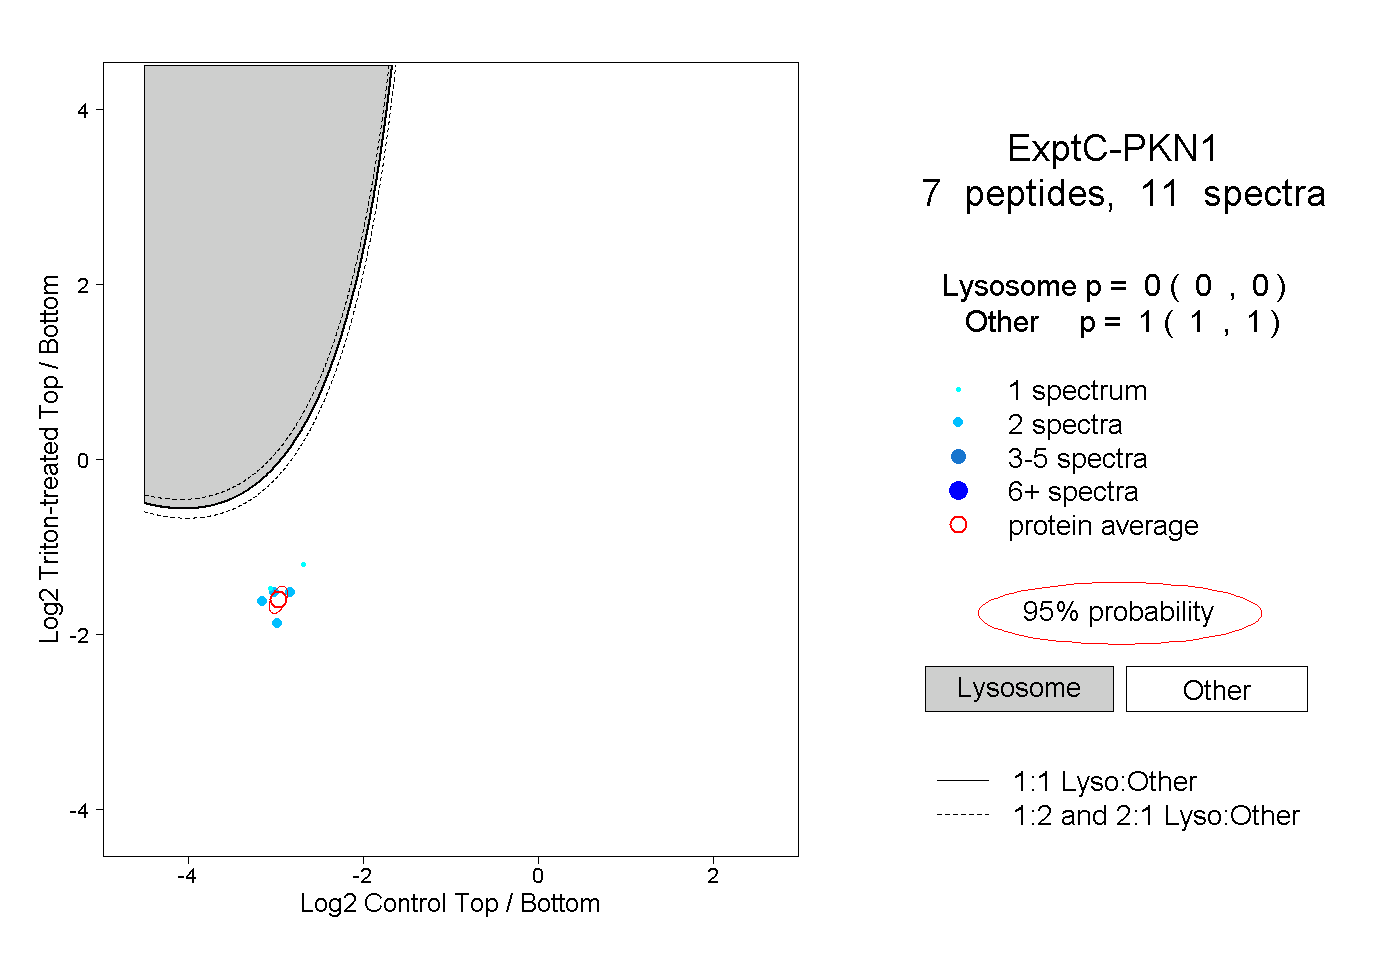
| Expt C |
7
peptides |
11
spectra |
 |
|
0.000
0.000 | 0.000 |
|
|
|
|
|
|
|
1.000
1.000 | 1.000 |
| 2 spectra, AVSEAQEK |
|
0.000 |
|
|
|
|
|
|
|
1.000 |
| 1 spectrum, TLDWDALLAR |
|
0.000 |
|
|
|
|
|
|
|
1.000 |
| 2 spectra, ATTDLGR |
|
0.000 |
|
|
|
|
|
|
|
1.000 |
| 2 spectra, ILATVTR |
|
0.000 |
|
|
|
|
|
|
|
1.000 |
| 1 spectrum, QQGQTFQR |
|
0.000 |
|
|
|
|
|
|
|
1.000 |
| 2 spectra, VEHAVAEGAK |
|
0.000 |
|
|
|
|
|
|
|
1.000 |
| 1 spectrum, NPILER |
|
0.000 |
|
|
|
|
|
|
|
1.000 |