 3
3peptides
spectra
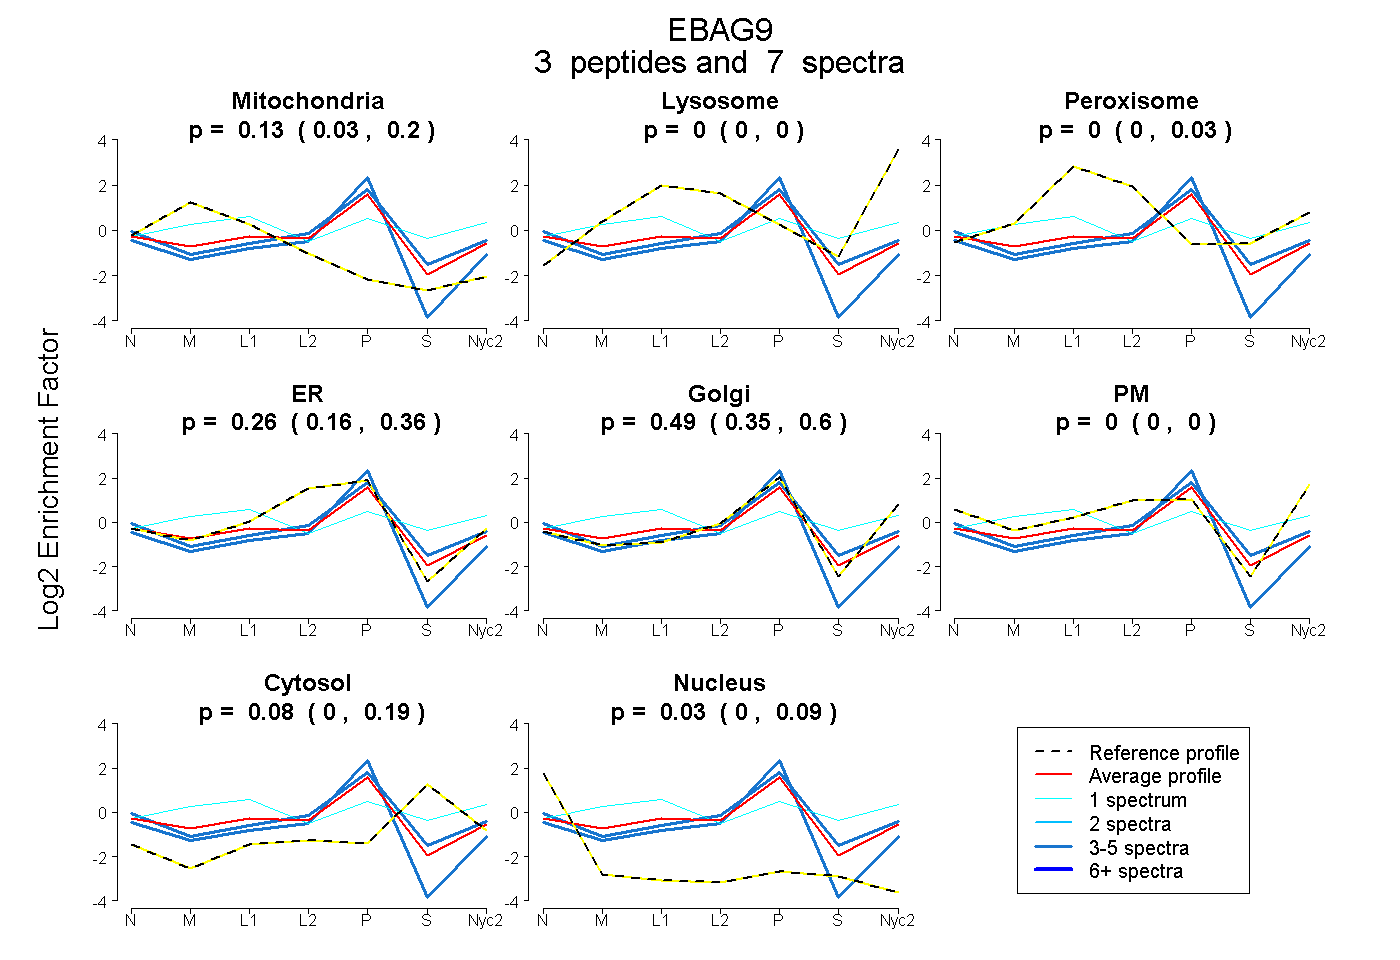
0.035 | 0.196
0.000 | 0.000
0.000 | 0.028
0.163 | 0.359
0.346 | 0.600
0.000 | 0.000
0.000 | 0.186
0.000 | 0.089
1peptide
spectra
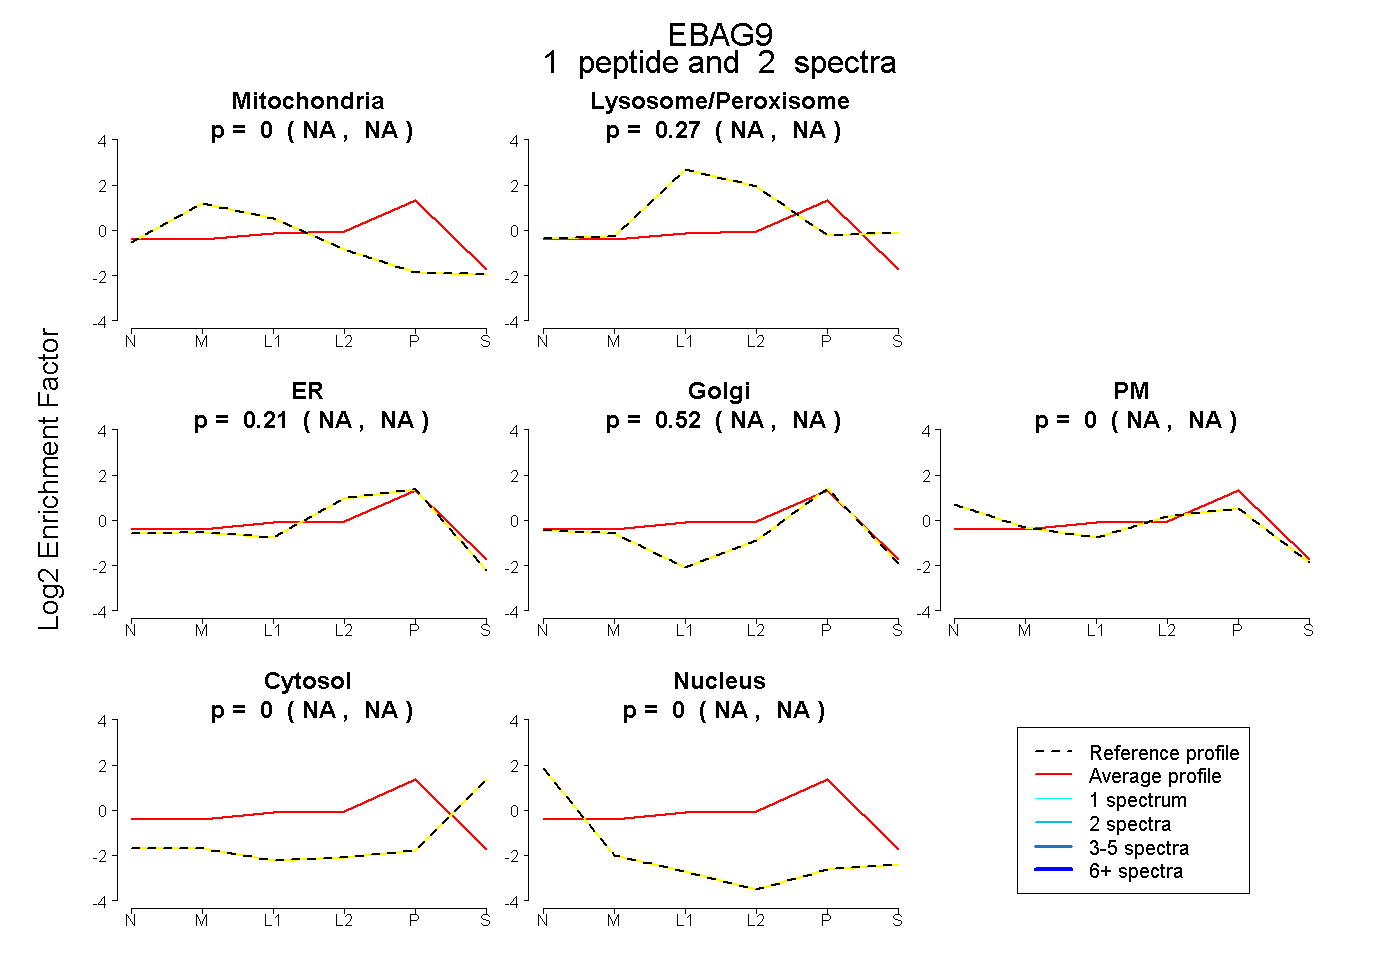
NA | NA
NA | NA
NA | NA
NA | NA
NA | NA
NA | NA
NA | NA
1peptide
spectra
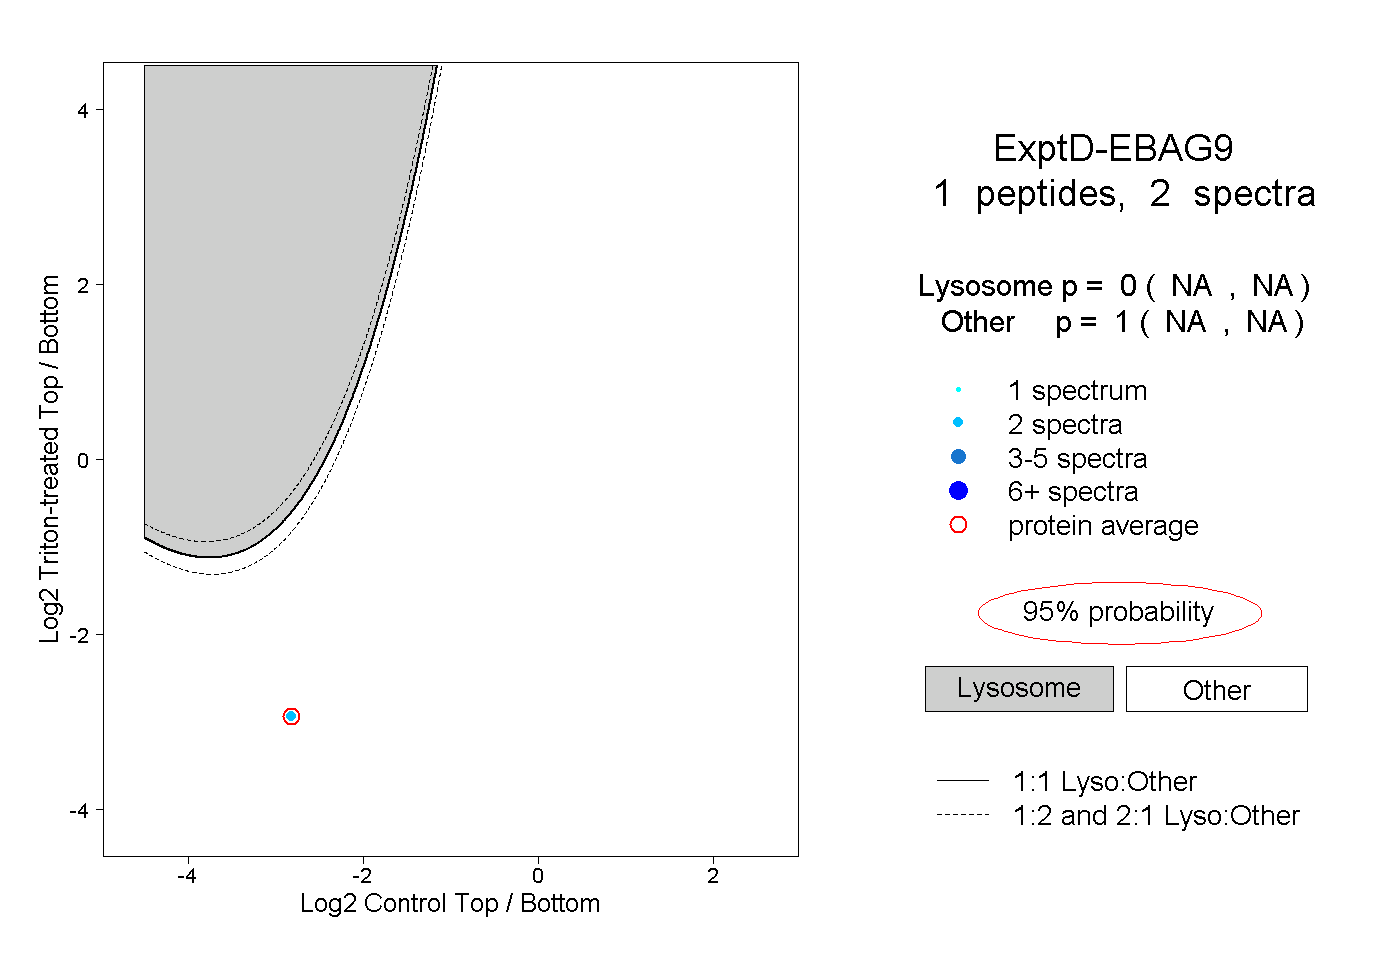
NA | NA
NA | NA