 3
3peptides
spectra
0.035 | 0.196
0.000 | 0.000
0.000 | 0.028
0.163 | 0.359
0.346 | 0.600
0.000 | 0.000
0.000 | 0.186
0.000 | 0.089
| Plot | Mito | Lyso | Perox | ER | Golgi | PM | Cytosol | Nucleus | |||||
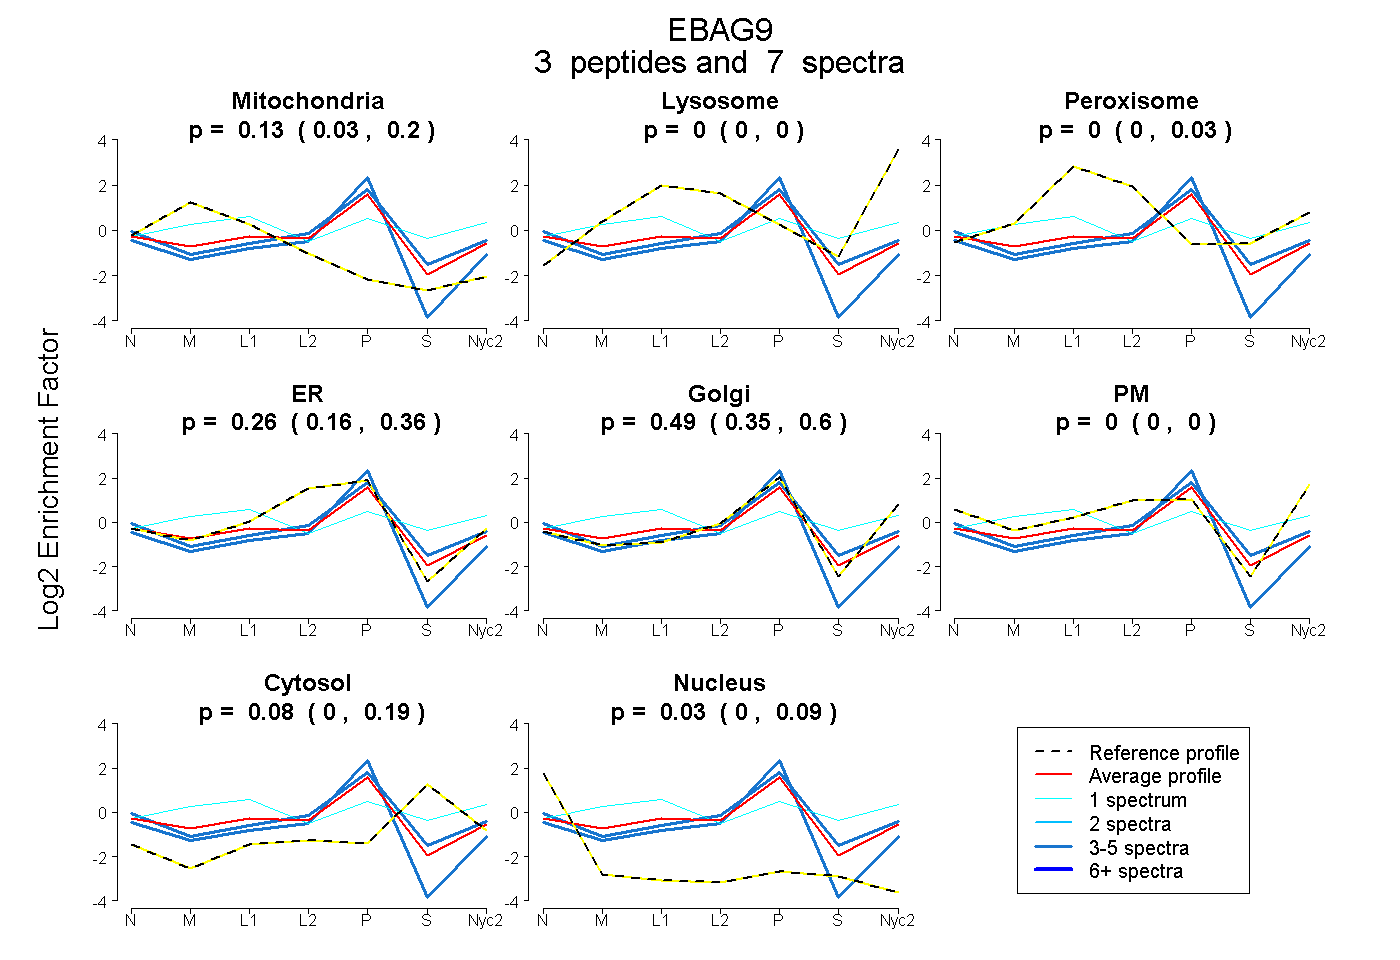
| Expt A |
3 peptides |
7 spectra |
|
0.134 0.035 | 0.196 |
0.000 0.000 | 0.000 |
0.000 0.000 | 0.028 |
0.265 0.163 | 0.359 |
0.495 0.346 | 0.600 |
0.000 0.000 | 0.000 |
0.076 0.000 | 0.186 |
0.030 0.000 | 0.089 |
| 3 spectra, DMTPTIR | 0.000 | 0.000 | 0.000 | 0.392 | 0.455 | 0.000 | 0.000 | 0.153 | ||
| 3 spectra, AITQFR | 0.000 | 0.000 | 0.000 | 0.351 | 0.447 | 0.000 | 0.155 | 0.047 | ||
| 1 spectrum, EPLSFGVPDGSTGFSSR | 0.141 | 0.066 | 0.287 | 0.000 | 0.317 | 0.000 | 0.189 | 0.000 |
| Plot | Mito | Lyso or Perox | ER | Golgi | PM | Cytosol | Nucleus | ||||||
| Expt B |
1 peptide |
2 spectra |
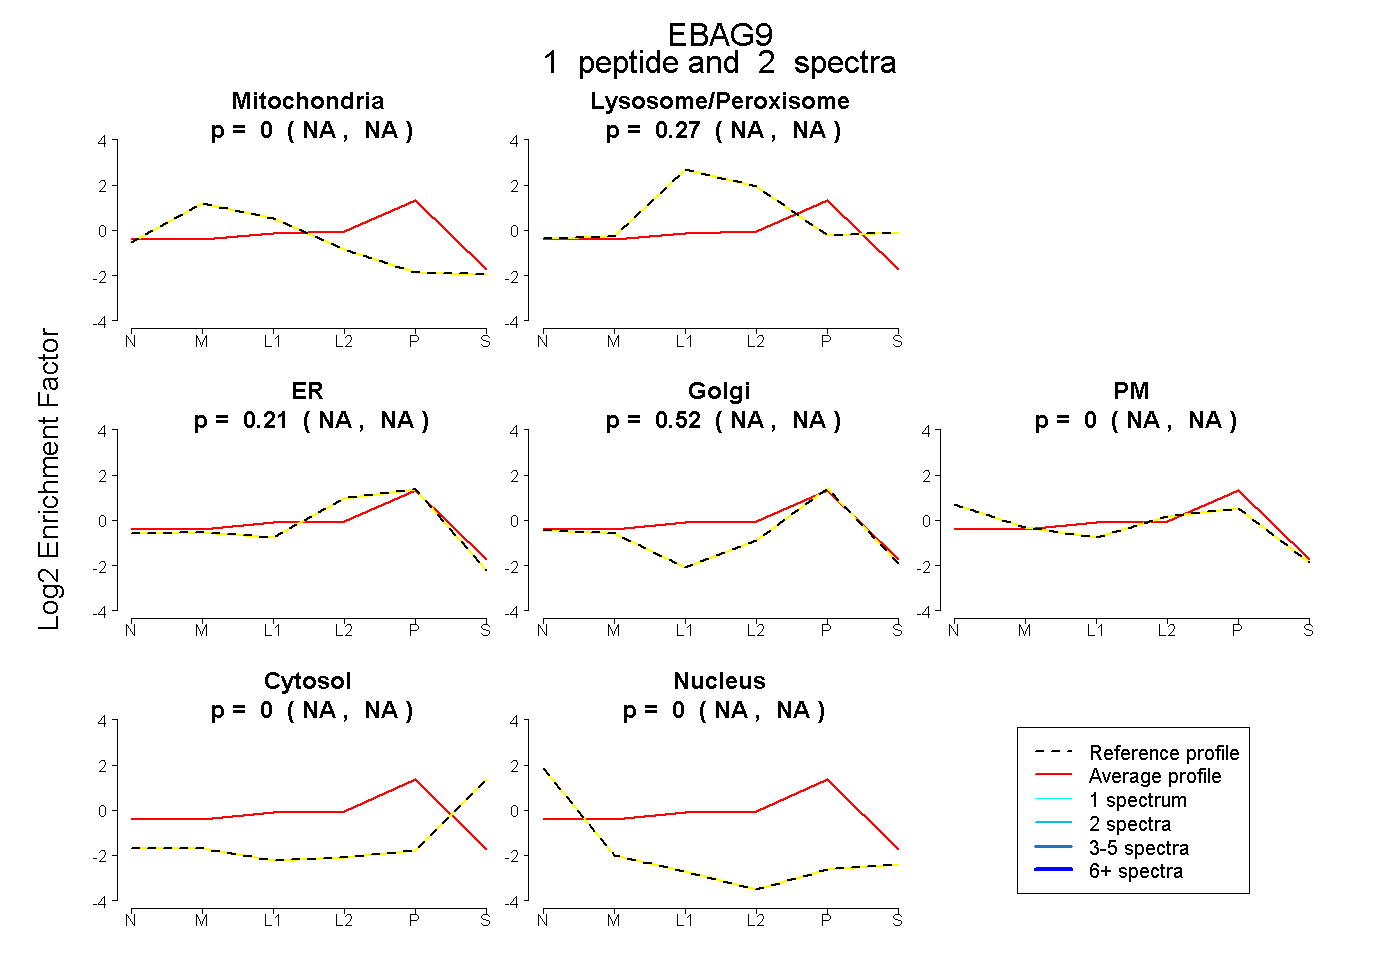 |
0.000 NA | NA |
0.270 NA | NA |
0.205 NA | NA |
0.525 NA | NA |
0.000 NA | NA |
0.000 NA | NA |
0.000 NA | NA |
|||
| Plot | Lyso | Other | |||||||||||
| Expt D |
1 peptide |
2 spectra |
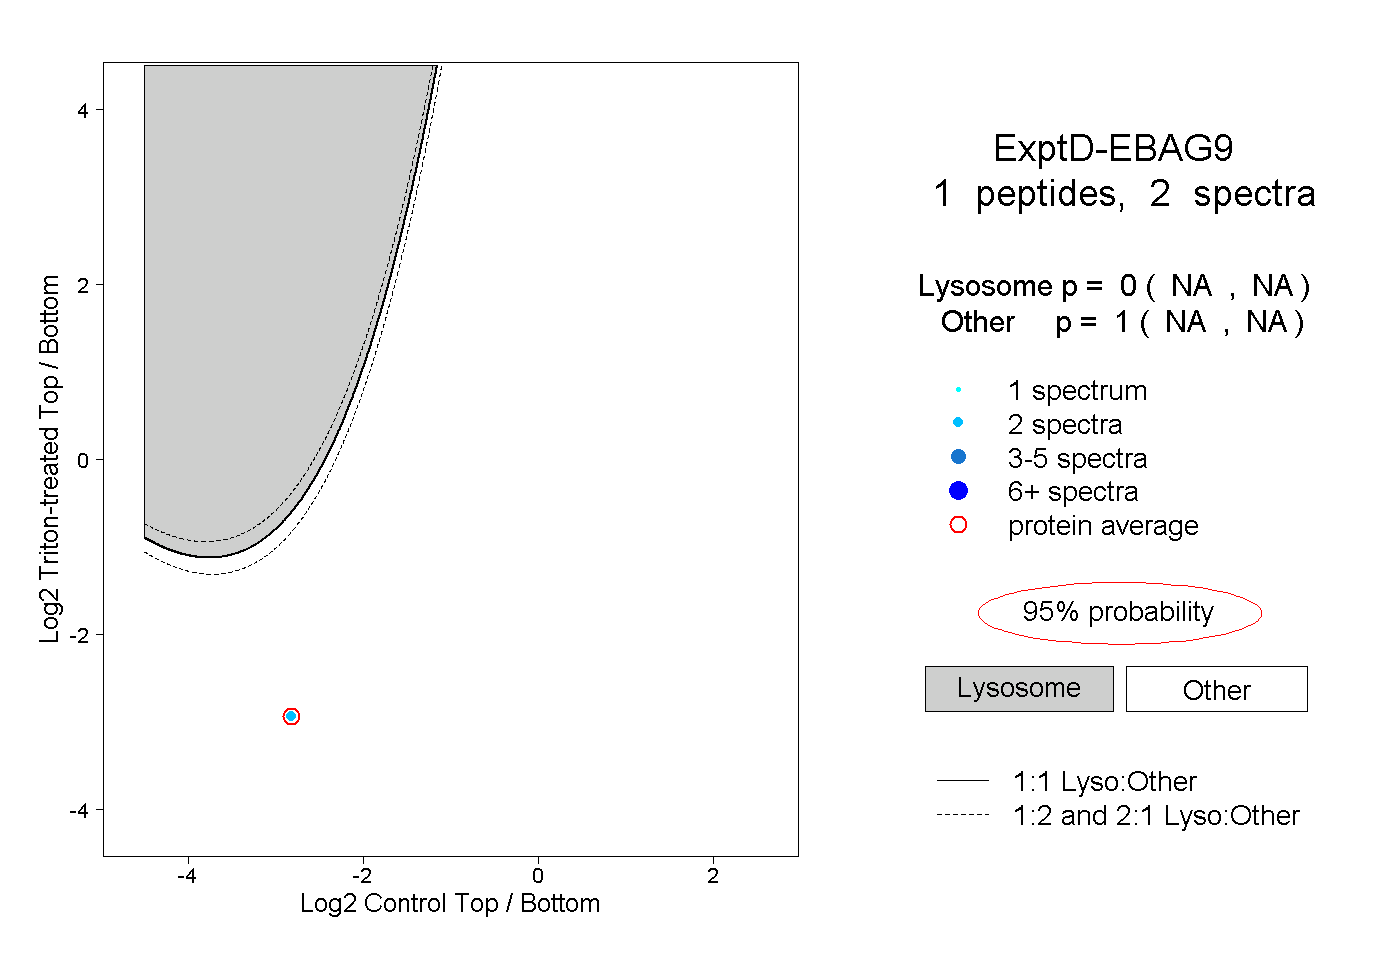 |
0.000 NA | NA |
1.000 NA | NA |