 8
8peptides
spectra
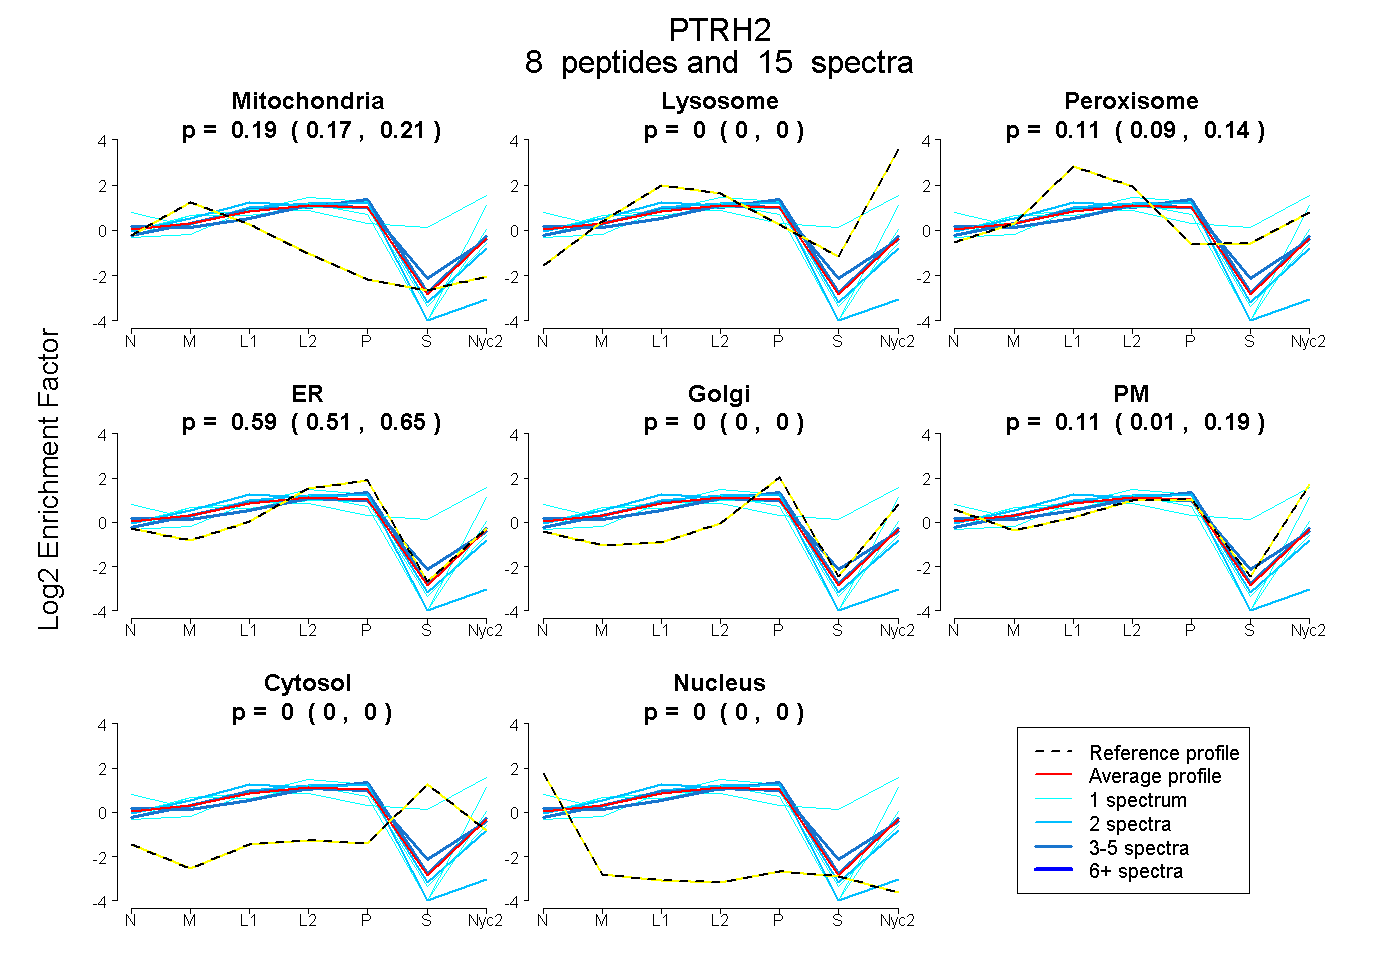
0.166 | 0.211
0.000 | 0.000
0.085 | 0.137
0.512 | 0.650
0.000 | 0.000
0.006 | 0.188
0.000 | 0.000
0.000 | 0.000
4peptides
spectra
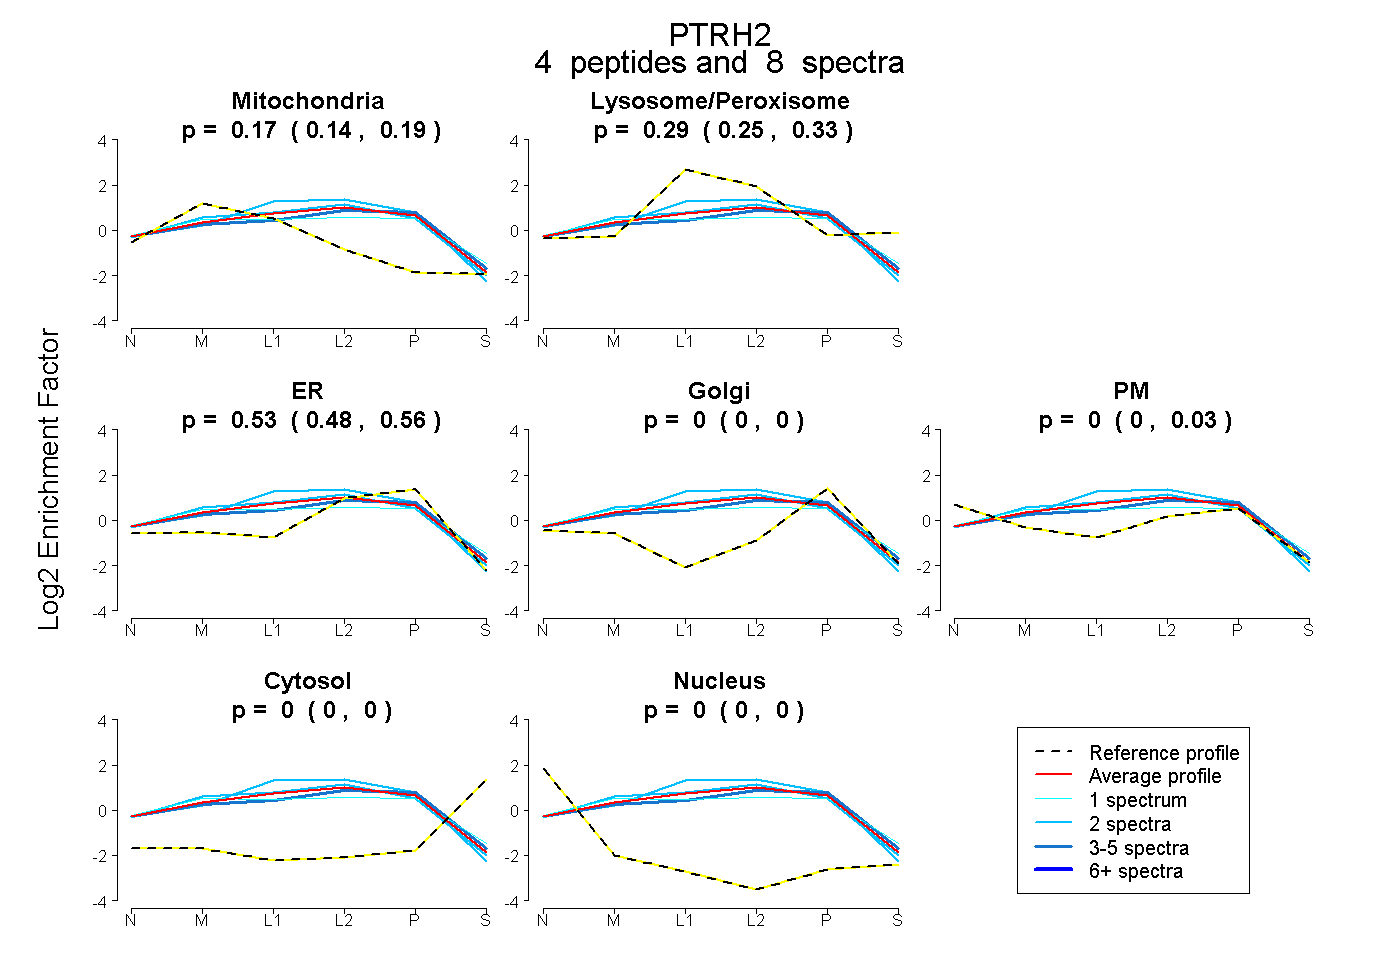
0.145 | 0.193
0.248 | 0.331
0.481 | 0.563
0.000 | 0.000
0.000 | 0.029
0.000 | 0.000
0.000 | 0.000
8peptides
spectra
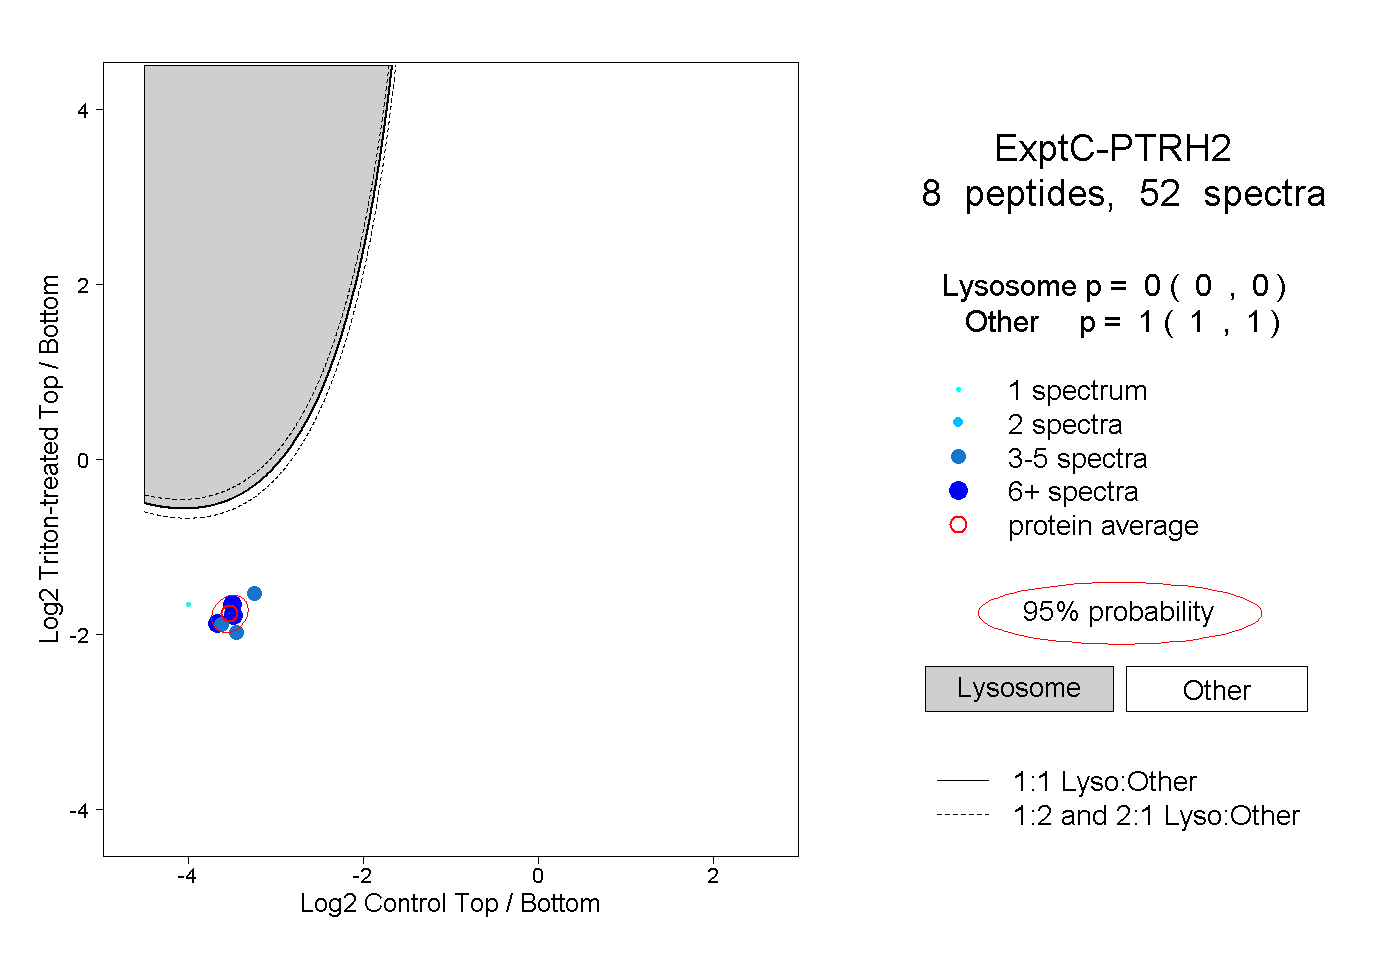
0.000 | 0.000
1.000 | 1.000
1peptide
spectra
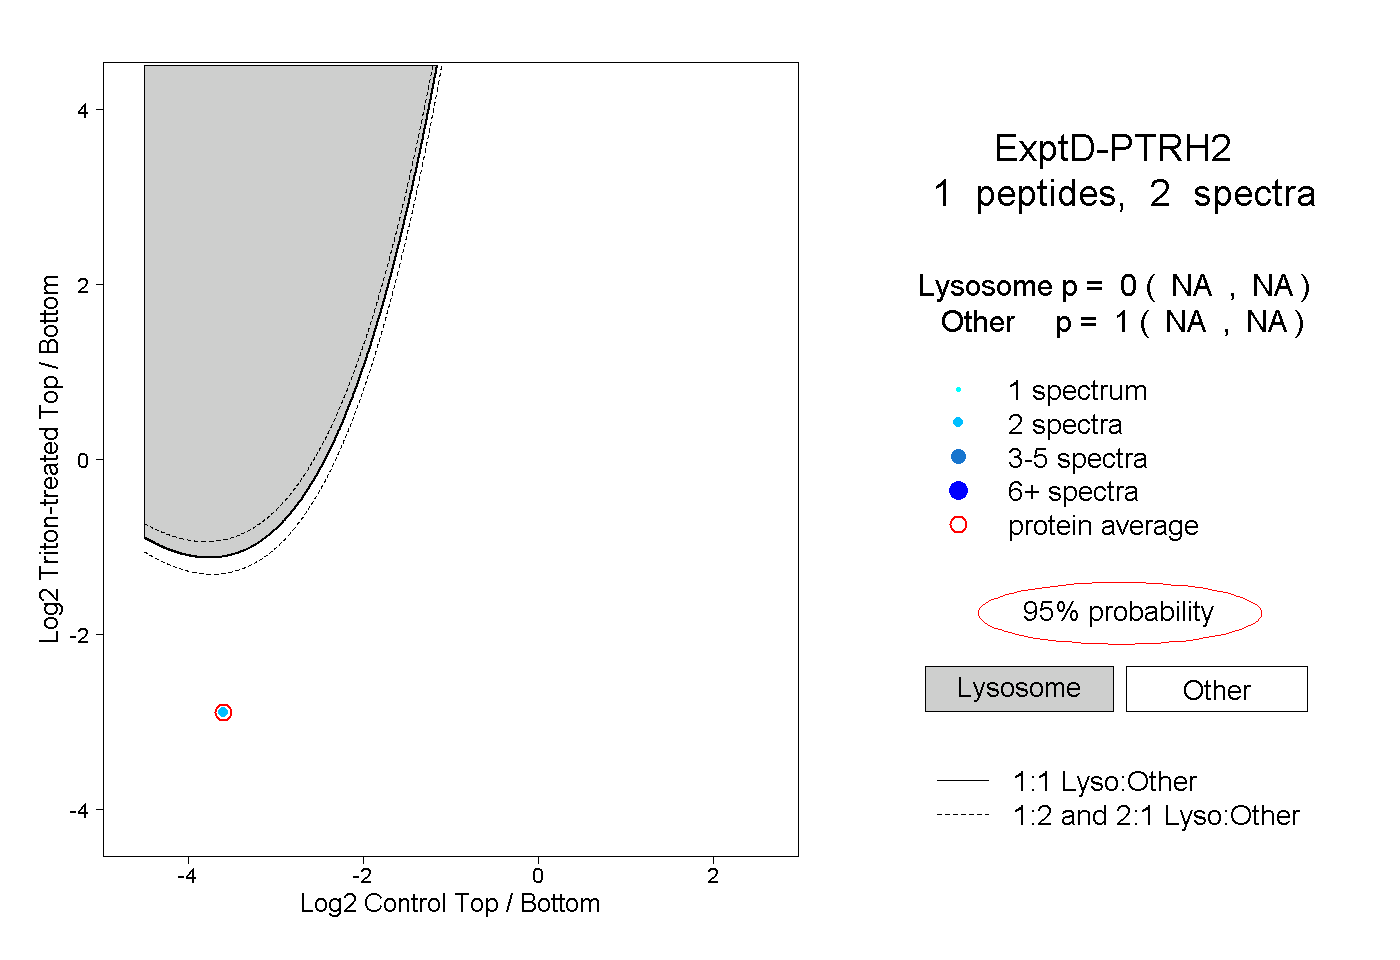
NA | NA
NA | NA