 8
8peptides
spectra
0.166 | 0.211
0.000 | 0.000
0.085 | 0.137
0.512 | 0.650
0.000 | 0.000
0.006 | 0.188
0.000 | 0.000
0.000 | 0.000
| Plot | Mito | Lyso | Perox | ER | Golgi | PM | Cytosol | Nucleus | |||||
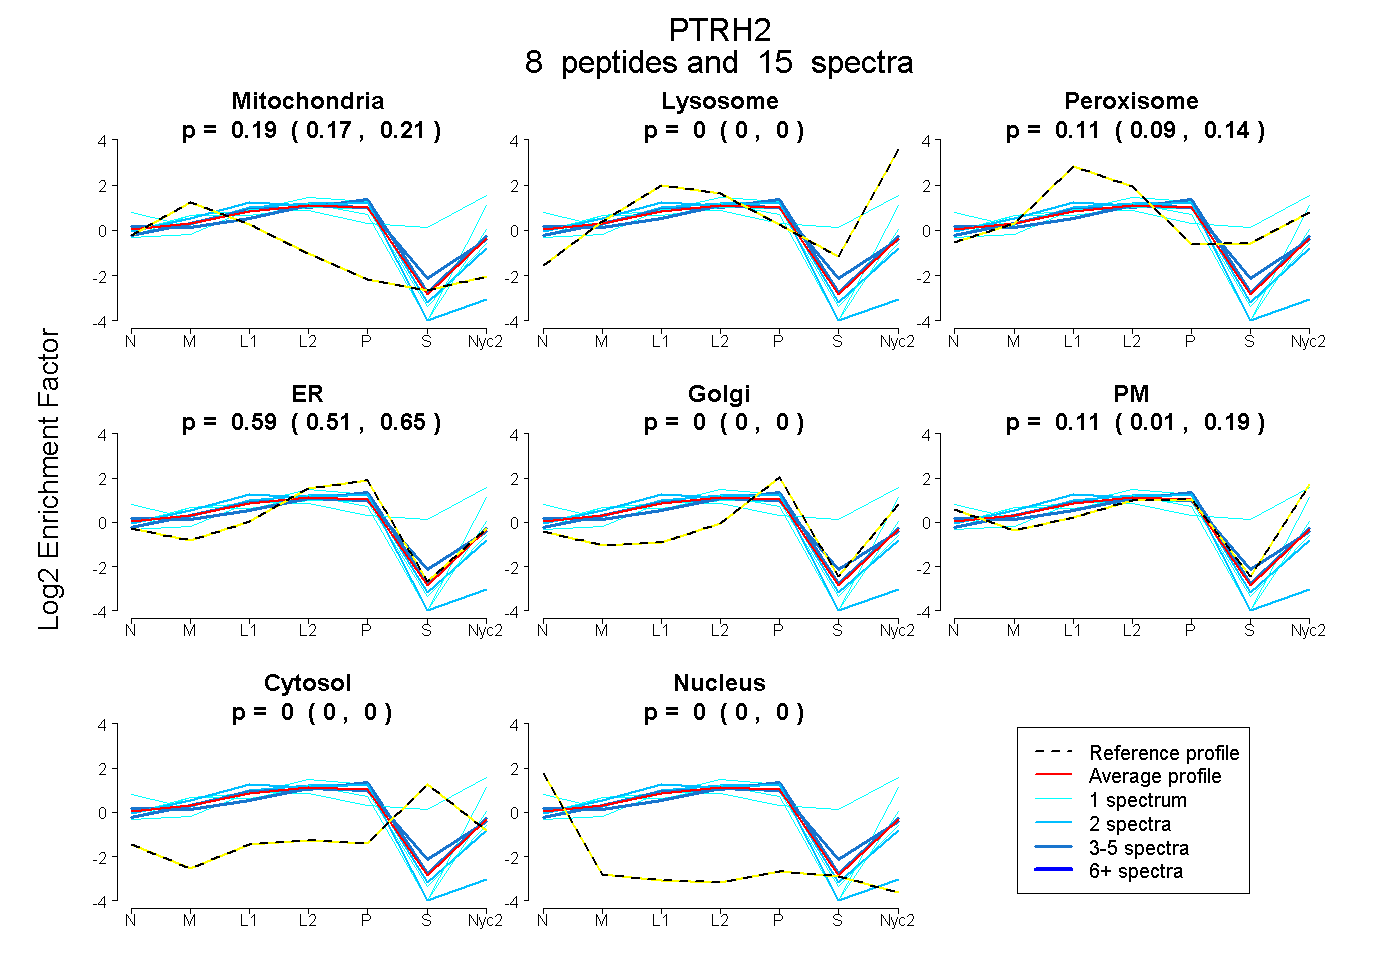
| Expt A |
8 peptides |
15 spectra |
|
0.190 0.166 | 0.211 |
0.000 0.000 | 0.000 |
0.114 0.085 | 0.137 |
0.587 0.512 | 0.650 |
0.000 0.000 | 0.000 |
0.109 0.006 | 0.188 |
0.000 0.000 | 0.000 |
0.000 0.000 | 0.000 |
| 1 spectrum, NPQVLK | 0.287 | 0.015 | 0.000 | 0.621 | 0.000 | 0.077 | 0.000 | 0.000 | ||
| 1 spectrum, SHLGIFPQNSTSETNR | 0.000 | 0.295 | 0.257 | 0.000 | 0.000 | 0.210 | 0.238 | 0.000 | ||
| 4 spectra, TQIEPGSR | 0.180 | 0.000 | 0.140 | 0.573 | 0.000 | 0.107 | 0.000 | 0.000 | ||
| 2 spectra, VAAQCSHAAVSAYK | 0.383 | 0.000 | 0.000 | 0.617 | 0.000 | 0.000 | 0.000 | 0.000 | ||
| 1 spectrum, DTEMGTEASILGESGEYK | 0.113 | 0.000 | 0.000 | 0.069 | 0.000 | 0.817 | 0.000 | 0.000 | ||
| 1 spectrum, ALGLTVSLIQDAGR | 0.165 | 0.088 | 0.000 | 0.660 | 0.000 | 0.086 | 0.000 | 0.000 | ||
| 2 spectra, APDEDSLIQLLTHAK | 0.205 | 0.000 | 0.070 | 0.726 | 0.000 | 0.000 | 0.000 | 0.000 | ||
| 3 spectra, MILVVR | 0.164 | 0.069 | 0.077 | 0.689 | 0.000 | 0.000 | 0.000 | 0.000 |
| Plot | Mito | Lyso or Perox | ER | Golgi | PM | Cytosol | Nucleus | ||||||
| Expt B |
4 peptides |
8 spectra |
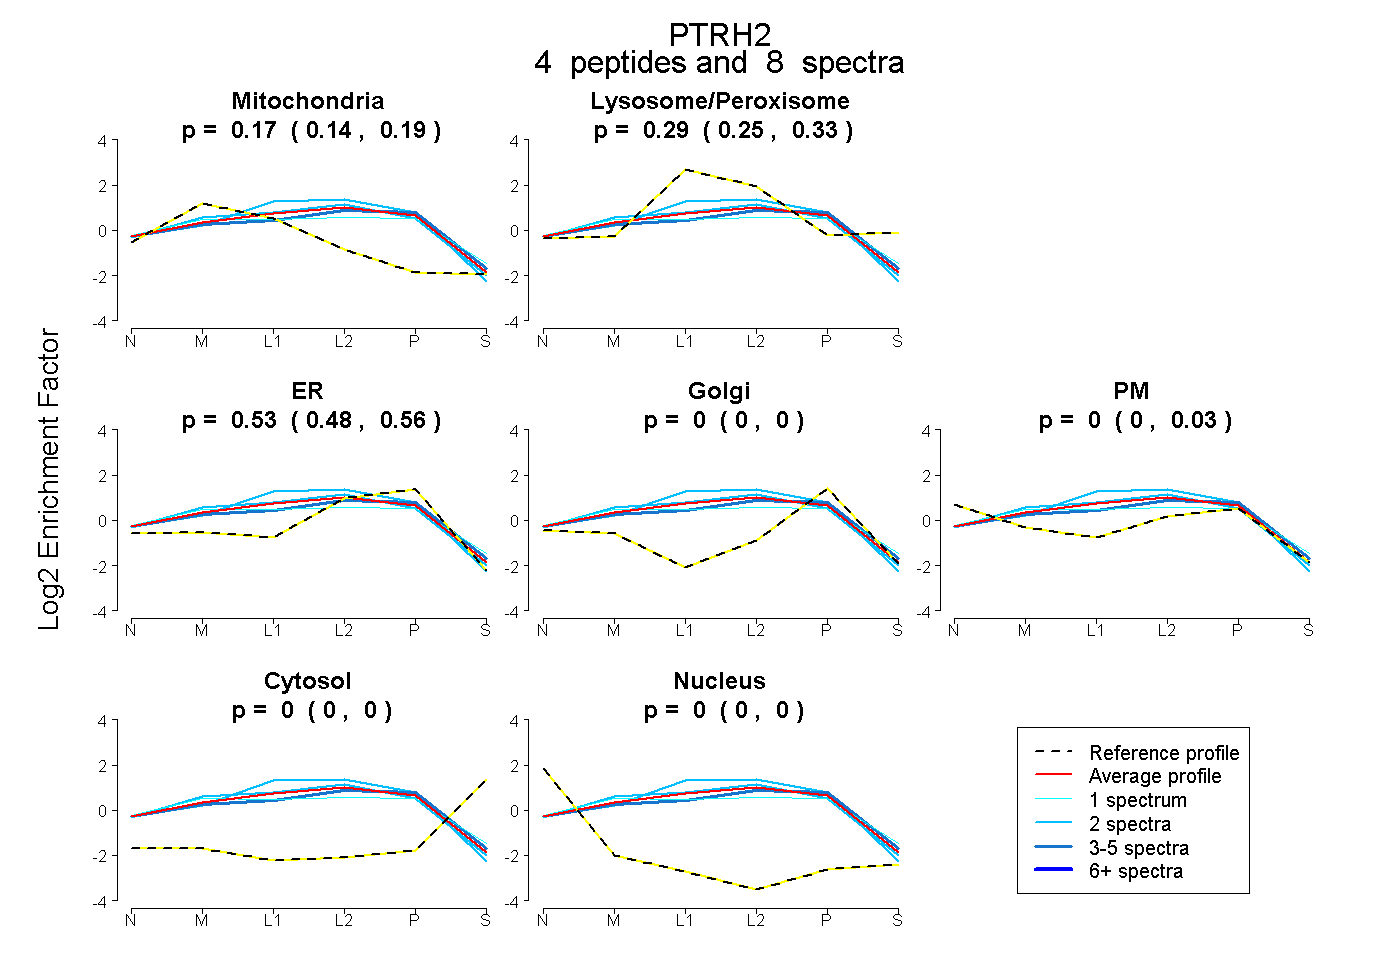 |
0.172 0.145 | 0.193 |
0.294 0.248 | 0.331 |
0.534 0.481 | 0.563 |
0.000 0.000 | 0.000 |
0.000 0.000 | 0.029 |
0.000 0.000 | 0.000 |
0.000 0.000 | 0.000 |
|||
| Plot | Lyso | Other | |||||||||||
| Expt C |
8 peptides |
52 spectra |
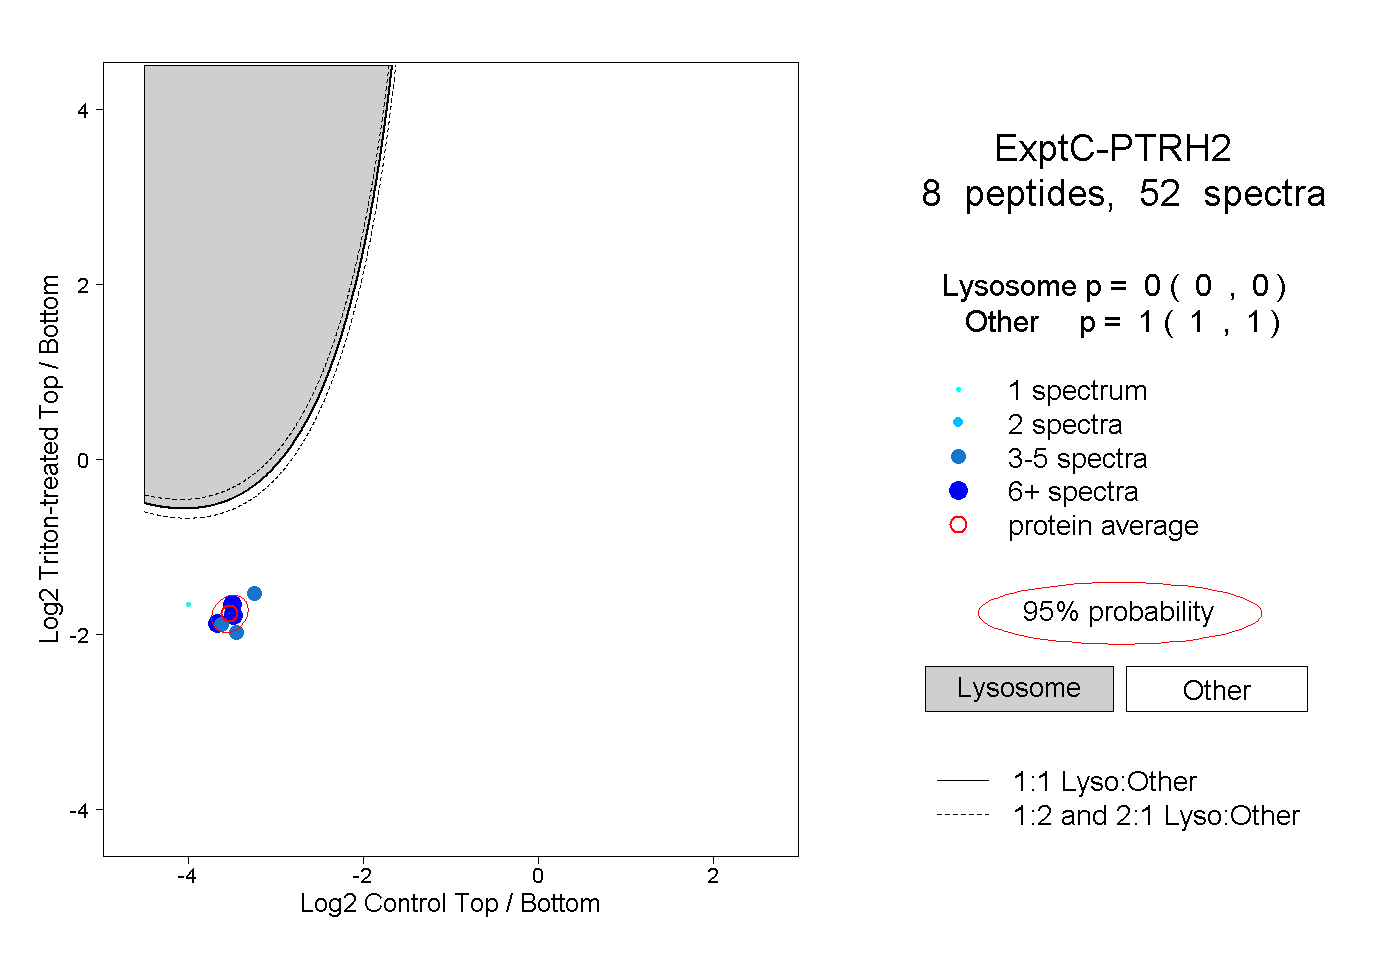 |
0.000 0.000 | 0.000 |
1.000 1.000 | 1.000 |
||||||||
| Plot | Lyso | Other | |||||||||||
| Expt D |
1 peptide |
2 spectra |
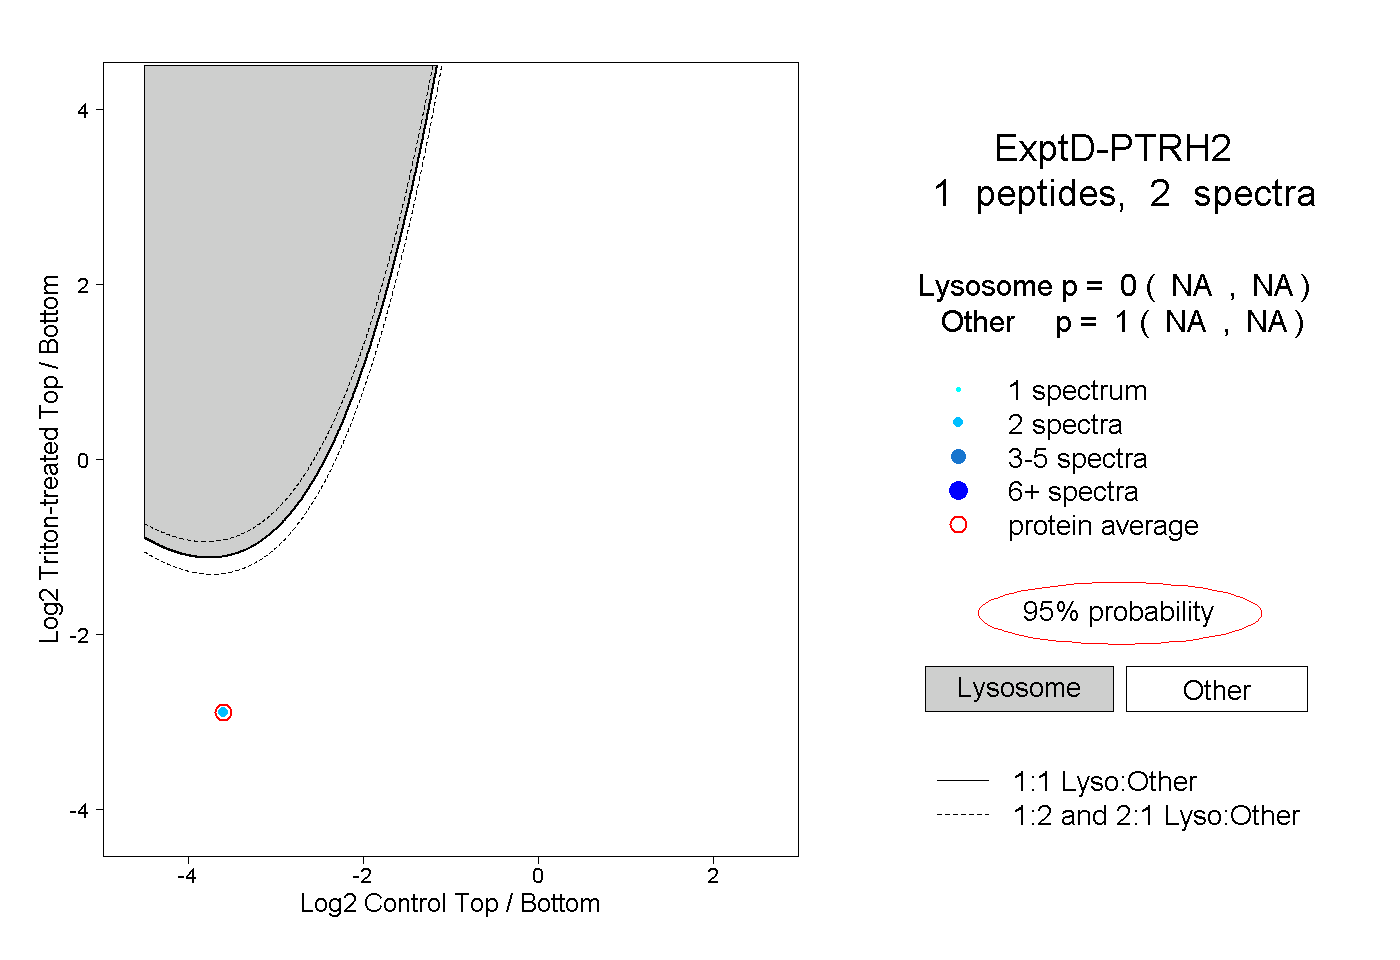 |
0.000 NA | NA |
1.000 NA | NA |