 25
25peptides
spectra
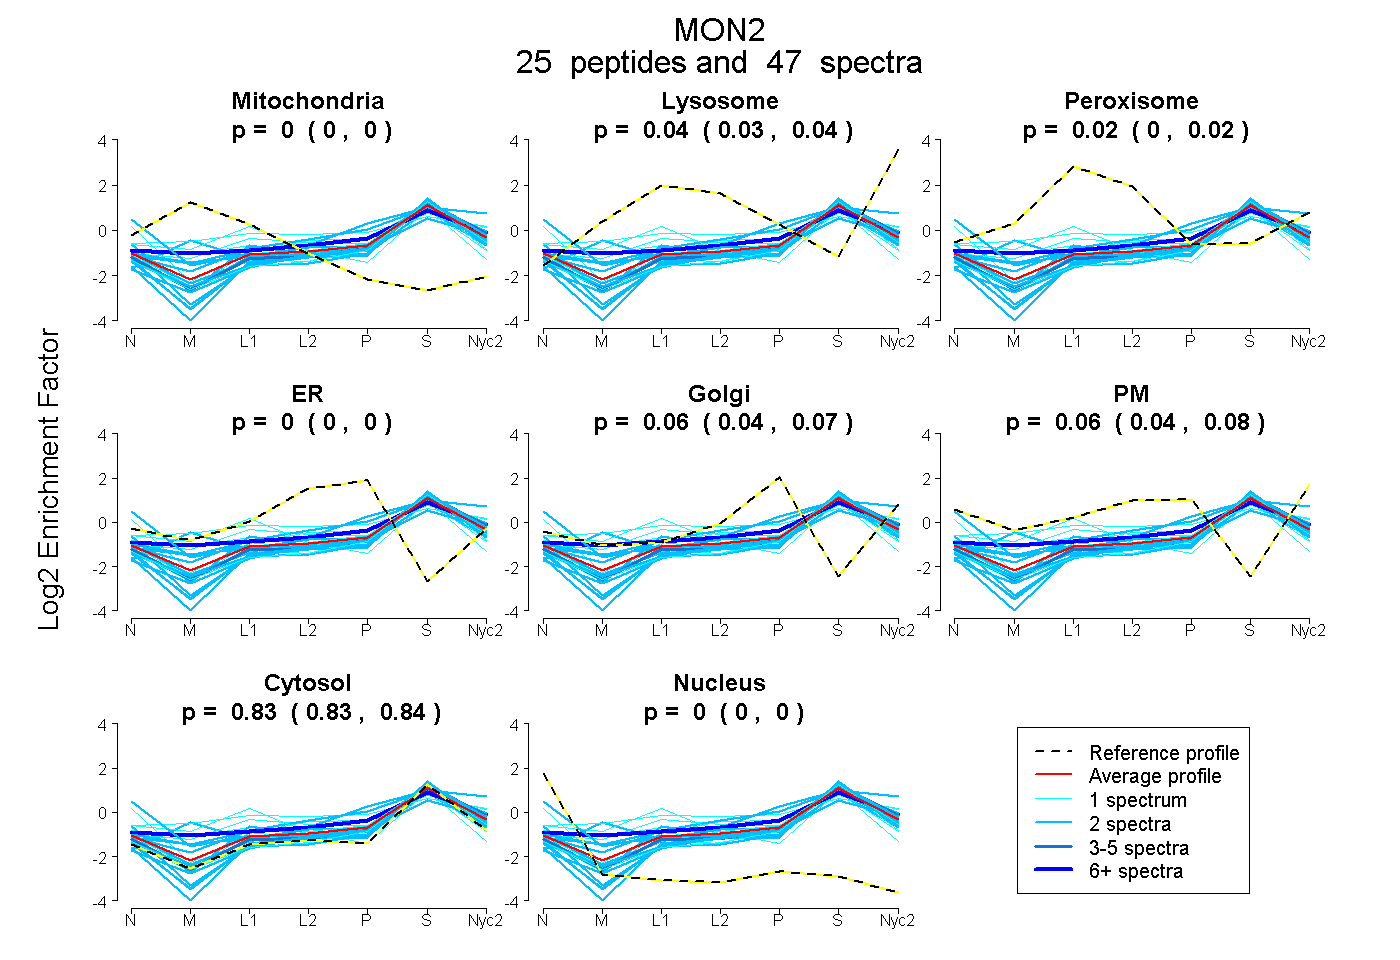
0.000 | 0.000
0.028 | 0.045
0.005 | 0.024
0.000 | 0.000
0.040 | 0.068
0.038 | 0.078
0.828 | 0.838
0.000 | 0.000
6peptides
spectra
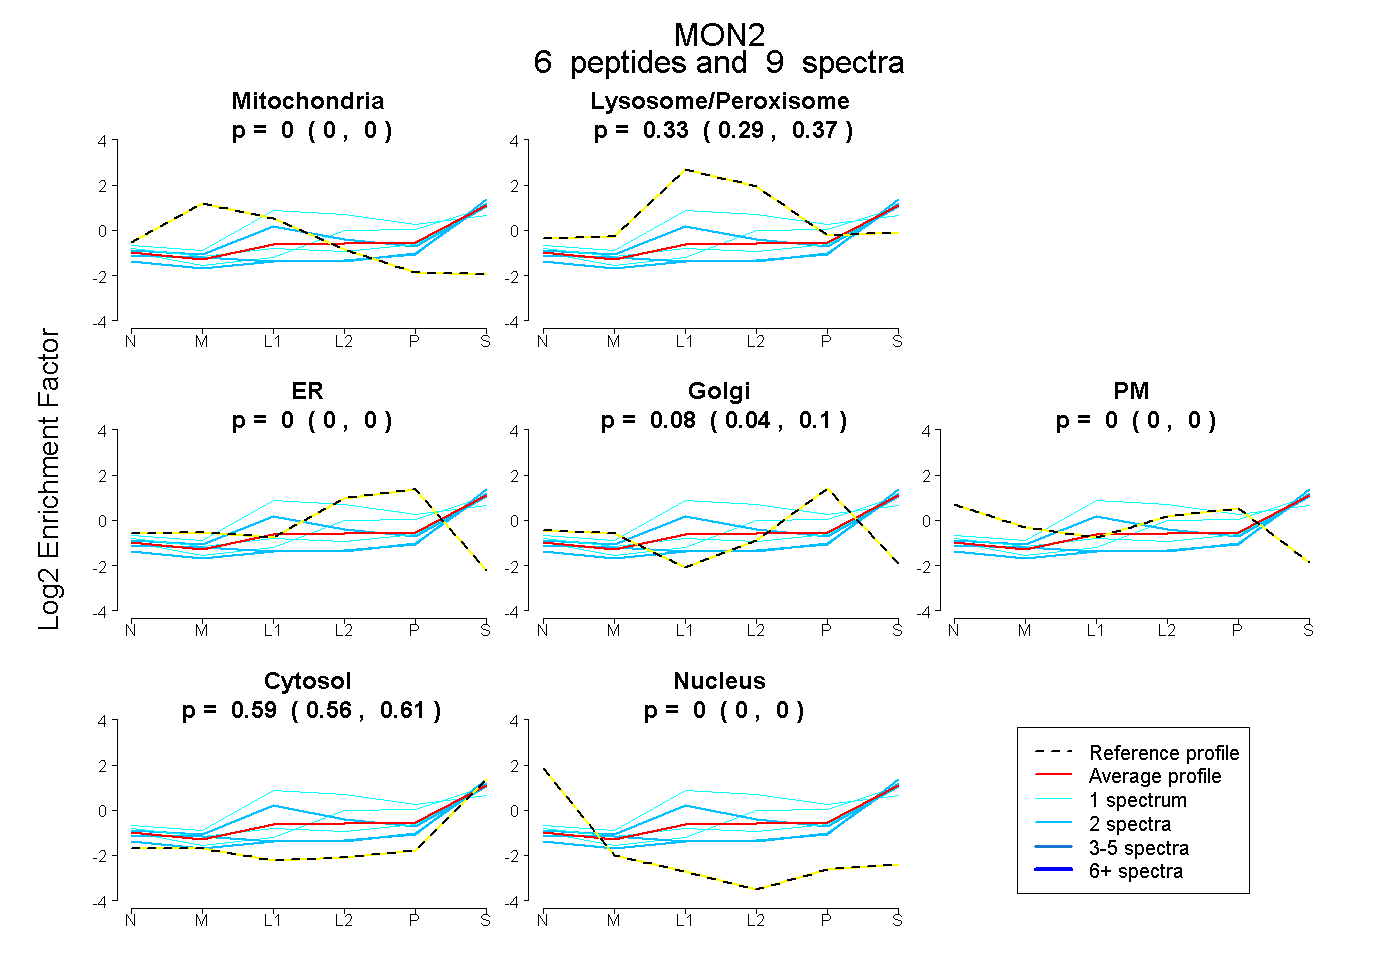
0.000 | 0.000
0.294 | 0.366
0.000 | 0.000
0.040 | 0.104
0.000 | 0.000
0.560 | 0.611
0.000 | 0.000
15peptides
spectra
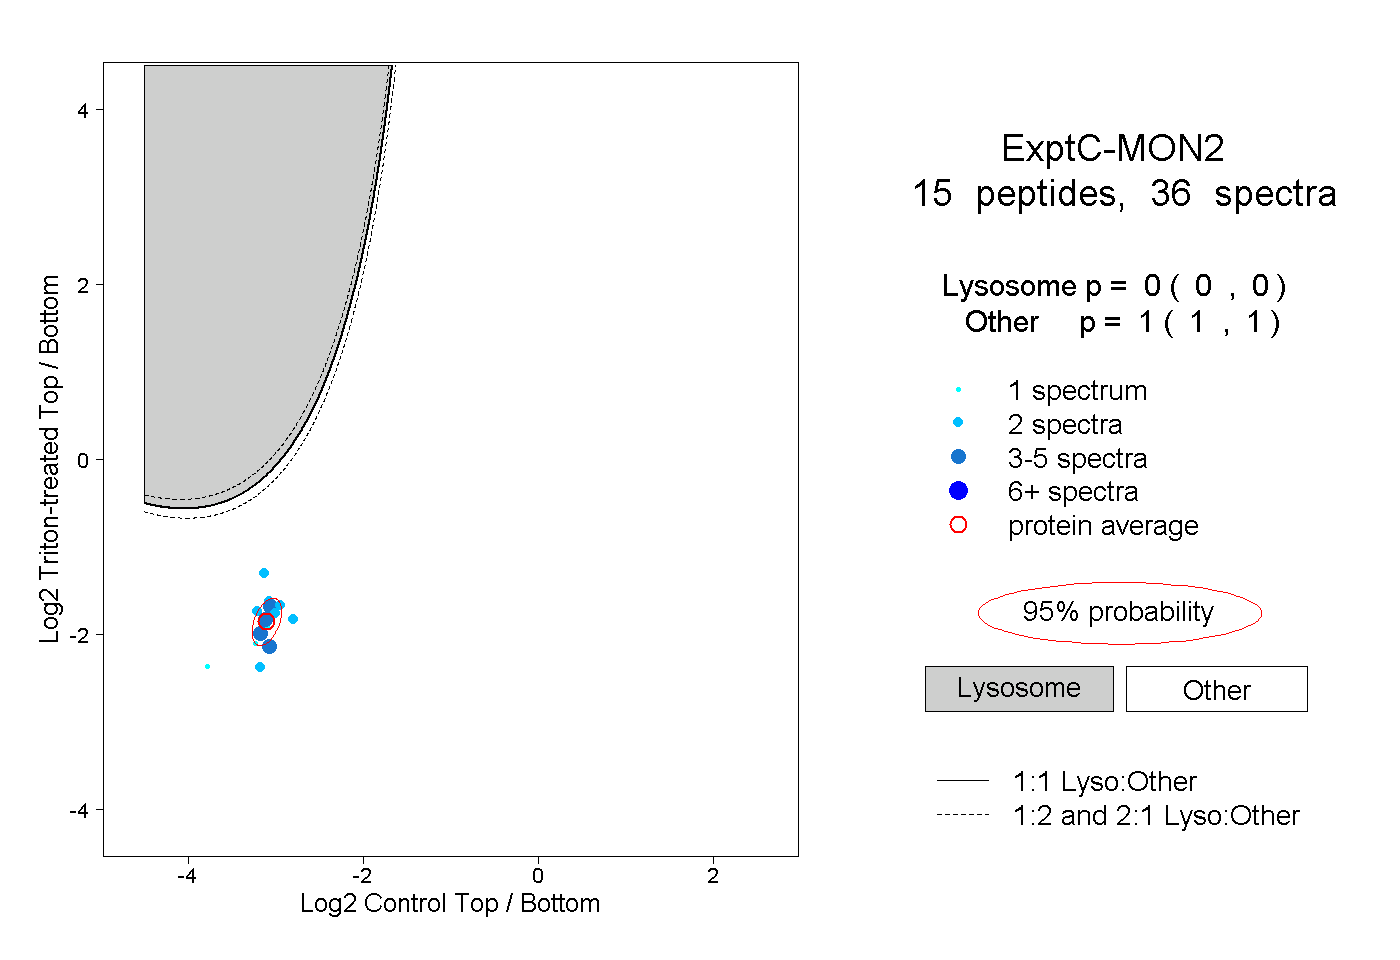
0.000 | 0.000
1.000 | 1.000
2peptides
spectra
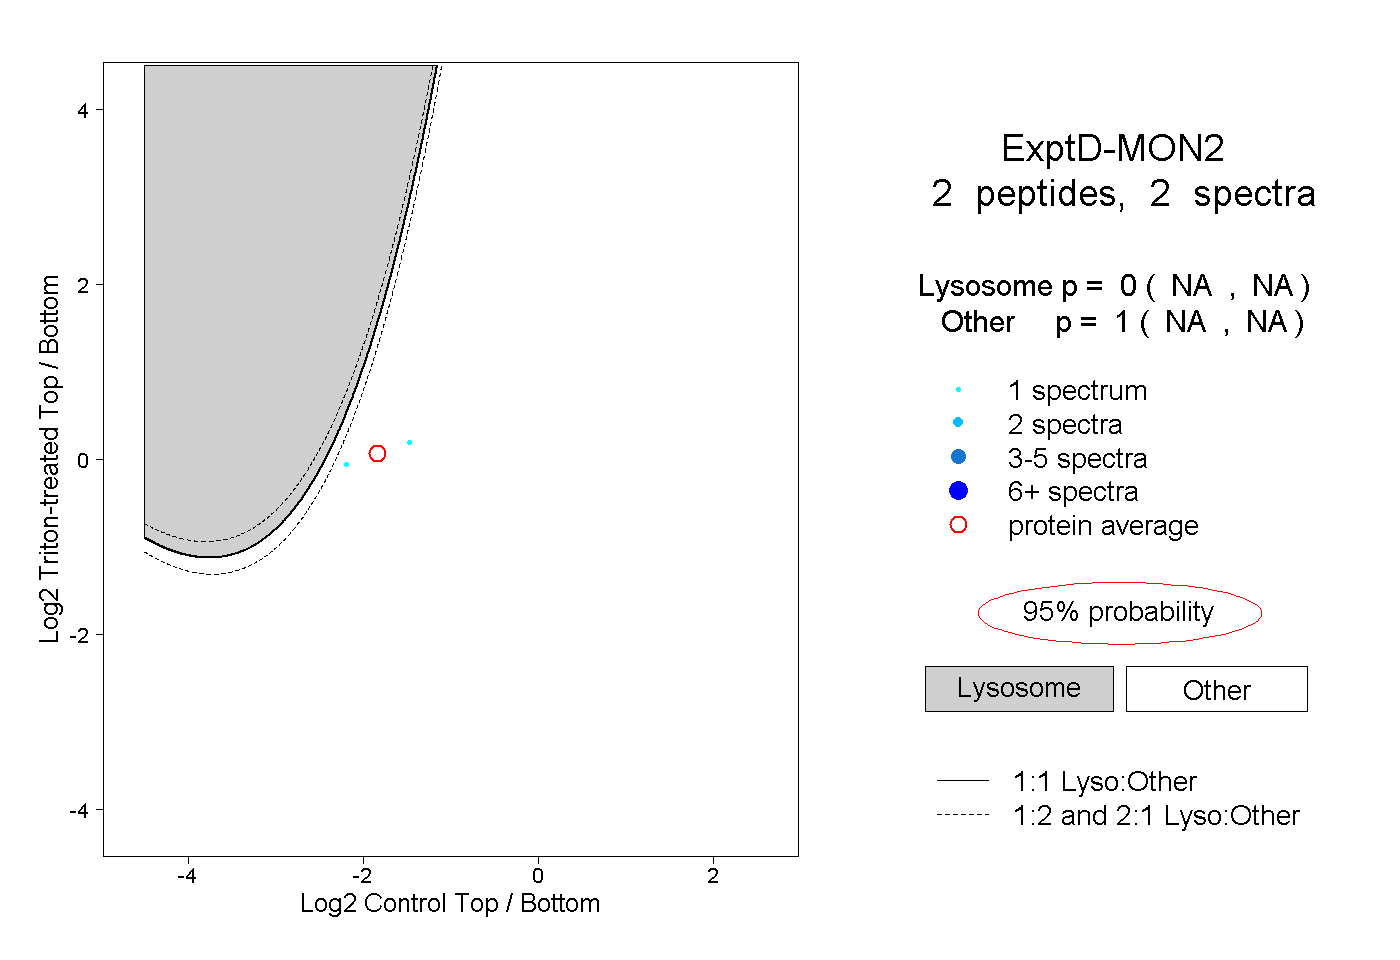
NA | NA
NA | NA