 25
25peptides
spectra
0.000 | 0.000
0.028 | 0.045
0.005 | 0.024
0.000 | 0.000
0.040 | 0.068
0.038 | 0.078
0.828 | 0.838
0.000 | 0.000
| Plot | Mito | Lyso | Perox | ER | Golgi | PM | Cytosol | Nucleus | |||||
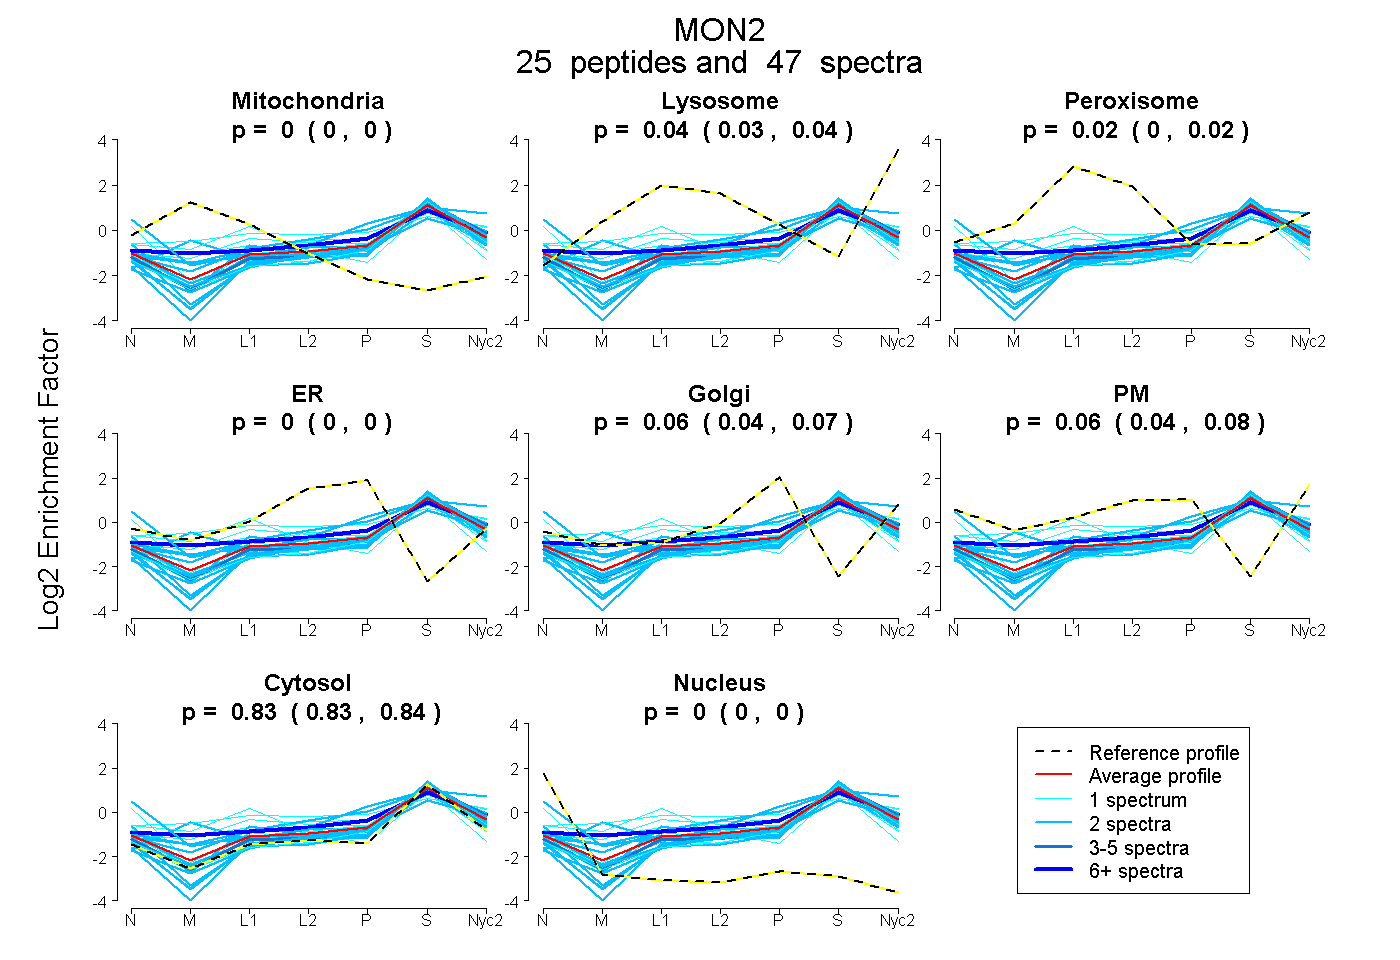
| Expt A |
25 peptides |
47 spectra |
|
0.000 0.000 | 0.000 |
0.037 0.028 | 0.045 |
0.016 0.005 | 0.024 |
0.000 0.000 | 0.000 |
0.055 0.040 | 0.068 |
0.059 0.038 | 0.078 |
0.833 0.828 | 0.838 |
0.000 0.000 | 0.000 |
| 2 spectra, LGLVTSR | 0.000 | 0.000 | 0.000 | 0.000 | 0.072 | 0.000 | 0.928 | 0.000 | ||
| 2 spectra, EPSLFAVAK | 0.000 | 0.225 | 0.000 | 0.000 | 0.124 | 0.000 | 0.651 | 0.000 | ||
| 4 spectra, QVVTVVFER | 0.000 | 0.055 | 0.000 | 0.000 | 0.059 | 0.000 | 0.886 | 0.000 | ||
| 2 spectra, NDQGESLIR | 0.000 | 0.105 | 0.000 | 0.000 | 0.000 | 0.108 | 0.787 | 0.000 | ||
| 1 spectrum, YSCPSESTWK | 0.000 | 0.000 | 0.000 | 0.000 | 0.063 | 0.000 | 0.937 | 0.000 | ||
| 2 spectra, YIEDER | 0.000 | 0.000 | 0.000 | 0.000 | 0.046 | 0.000 | 0.954 | 0.000 | ||
| 2 spectra, DAFITAICK | 0.000 | 0.034 | 0.124 | 0.000 | 0.118 | 0.000 | 0.724 | 0.000 | ||
| 2 spectra, AWDVLLDHIQSAALSK | 0.000 | 0.029 | 0.000 | 0.000 | 0.095 | 0.000 | 0.876 | 0.000 | ||
| 1 spectrum, LCVQPR | 0.164 | 0.000 | 0.228 | 0.000 | 0.000 | 0.000 | 0.608 | 0.000 | ||
| 2 spectra, VLFHLLDR | 0.000 | 0.000 | 0.000 | 0.000 | 0.020 | 0.000 | 0.980 | 0.000 | ||
| 1 spectrum, NNEVSLAALK | 0.000 | 0.028 | 0.000 | 0.000 | 0.103 | 0.017 | 0.851 | 0.000 | ||
| 1 spectrum, AELTMAALCGR | 0.153 | 0.000 | 0.110 | 0.028 | 0.000 | 0.000 | 0.710 | 0.000 | ||
| 2 spectra, EAAESGIIK | 0.000 | 0.011 | 0.025 | 0.000 | 0.000 | 0.136 | 0.828 | 0.000 | ||
| 1 spectrum, ALSLECK | 0.000 | 0.000 | 0.032 | 0.047 | 0.000 | 0.000 | 0.921 | 0.000 | ||
| 1 spectrum, AGFSMADLQK | 0.000 | 0.000 | 0.000 | 0.000 | 0.000 | 0.311 | 0.689 | 0.000 | ||
| 1 spectrum, DIDPPVLIQGNSNR | 0.000 | 0.030 | 0.237 | 0.000 | 0.061 | 0.000 | 0.672 | 0.000 | ||
| 1 spectrum, AVSTLIDSLK | 0.000 | 0.036 | 0.289 | 0.000 | 0.134 | 0.059 | 0.482 | 0.000 | ||
| 2 spectra, DNITNNTAAATVR | 0.000 | 0.000 | 0.000 | 0.000 | 0.000 | 0.000 | 1.000 | 0.000 | ||
| 2 spectra, AGLTFNHEPPLSQNQR | 0.191 | 0.098 | 0.000 | 0.000 | 0.000 | 0.000 | 0.711 | 0.000 | ||
| 2 spectra, VTTPQEGYISR | 0.000 | 0.000 | 0.000 | 0.000 | 0.046 | 0.000 | 0.954 | 0.000 | ||
| 2 spectra, VPLSLK | 0.000 | 0.000 | 0.025 | 0.000 | 0.000 | 0.268 | 0.601 | 0.106 | ||
| 6 spectra, LLETGLVNMHR | 0.013 | 0.071 | 0.104 | 0.000 | 0.140 | 0.009 | 0.663 | 0.000 | ||
| 2 spectra, SFQEILQIVSPAR | 0.000 | 0.000 | 0.000 | 0.000 | 0.037 | 0.000 | 0.963 | 0.000 | ||
| 2 spectra, LAVASLLK | 0.000 | 0.000 | 0.000 | 0.042 | 0.220 | 0.000 | 0.738 | 0.000 | ||
| 1 spectrum, ATYLEMLDK | 0.000 | 0.034 | 0.000 | 0.000 | 0.065 | 0.000 | 0.901 | 0.000 |
| Plot | Mito | Lyso or Perox | ER | Golgi | PM | Cytosol | Nucleus | ||||||
| Expt B |
6 peptides |
9 spectra |
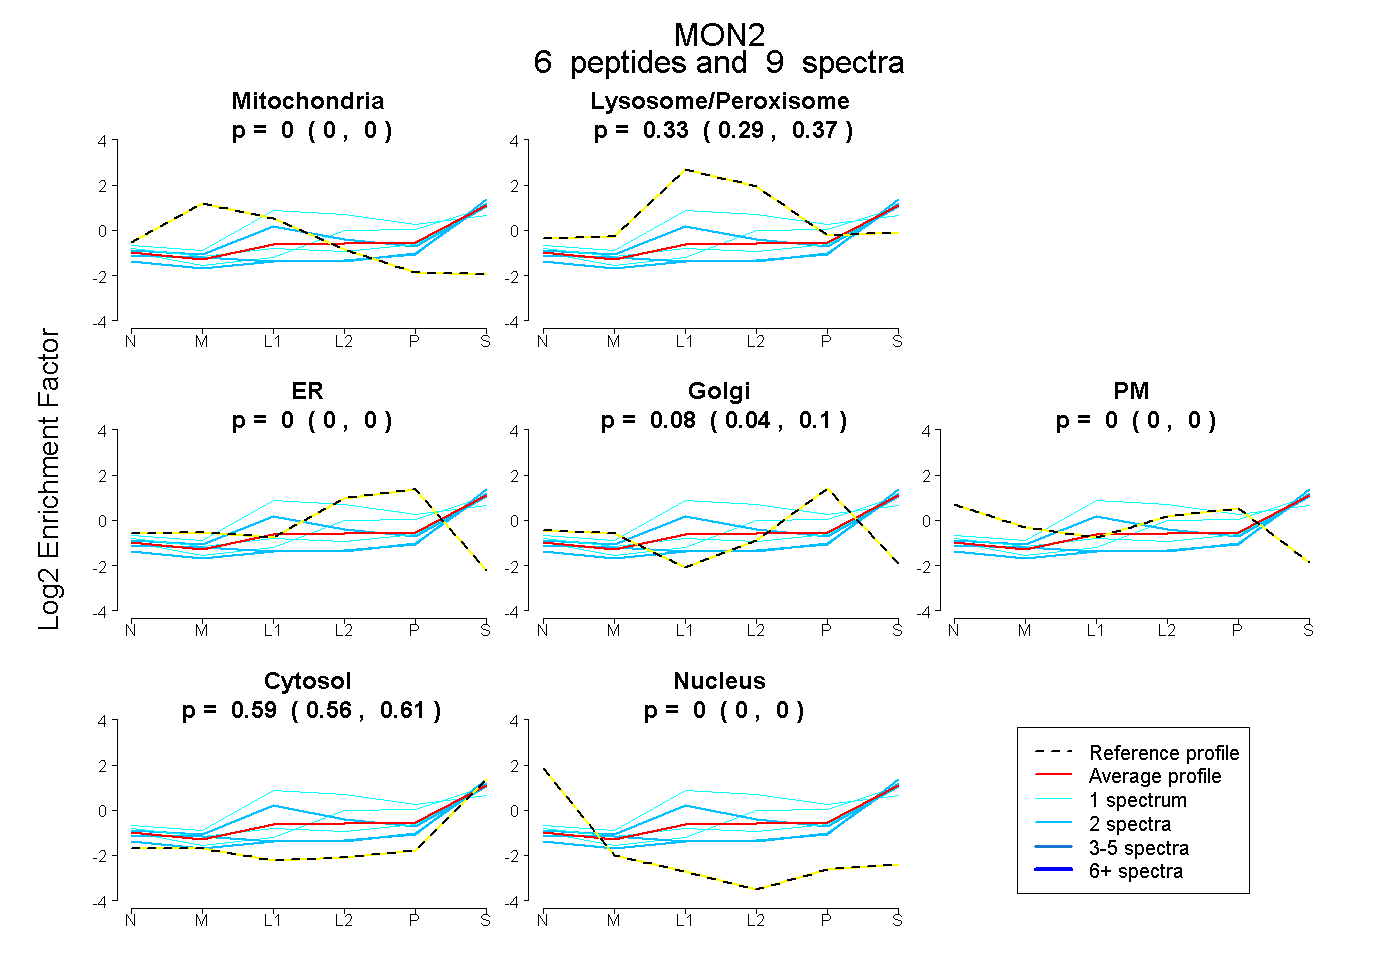 |
0.000 0.000 | 0.000 |
0.334 0.294 | 0.366 |
0.000 0.000 | 0.000 |
0.079 0.040 | 0.104 |
0.000 0.000 | 0.000 |
0.586 0.560 | 0.611 |
0.000 0.000 | 0.000 |
|||
| Plot | Lyso | Other | |||||||||||
| Expt C |
15 peptides |
36 spectra |
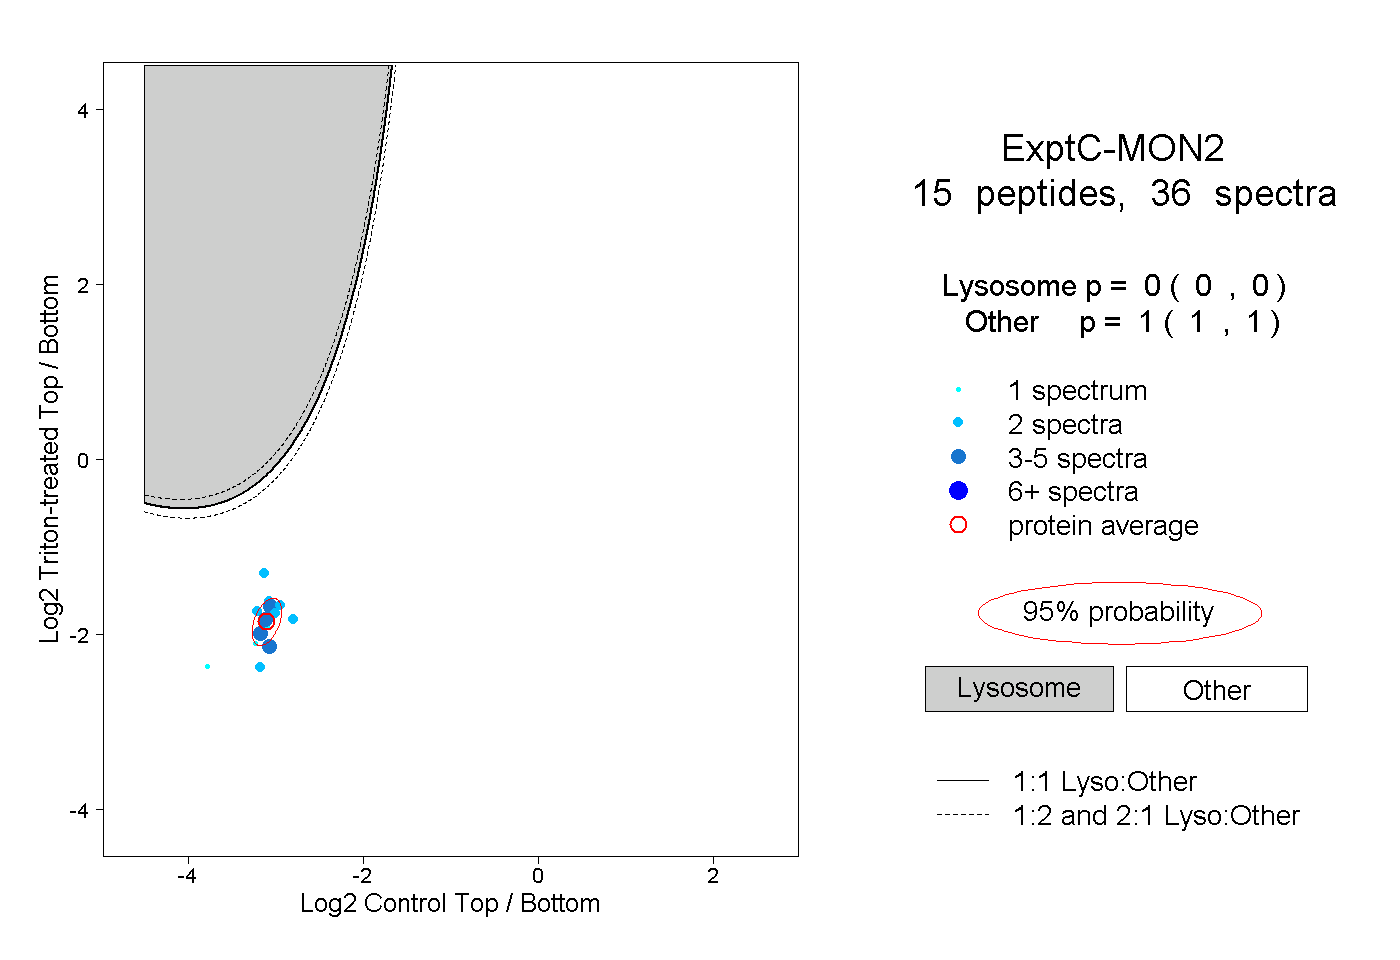 |
0.000 0.000 | 0.000 |
1.000 1.000 | 1.000 |
||||||||
| Plot | Lyso | Other | |||||||||||
| Expt D |
2 peptides |
2 spectra |
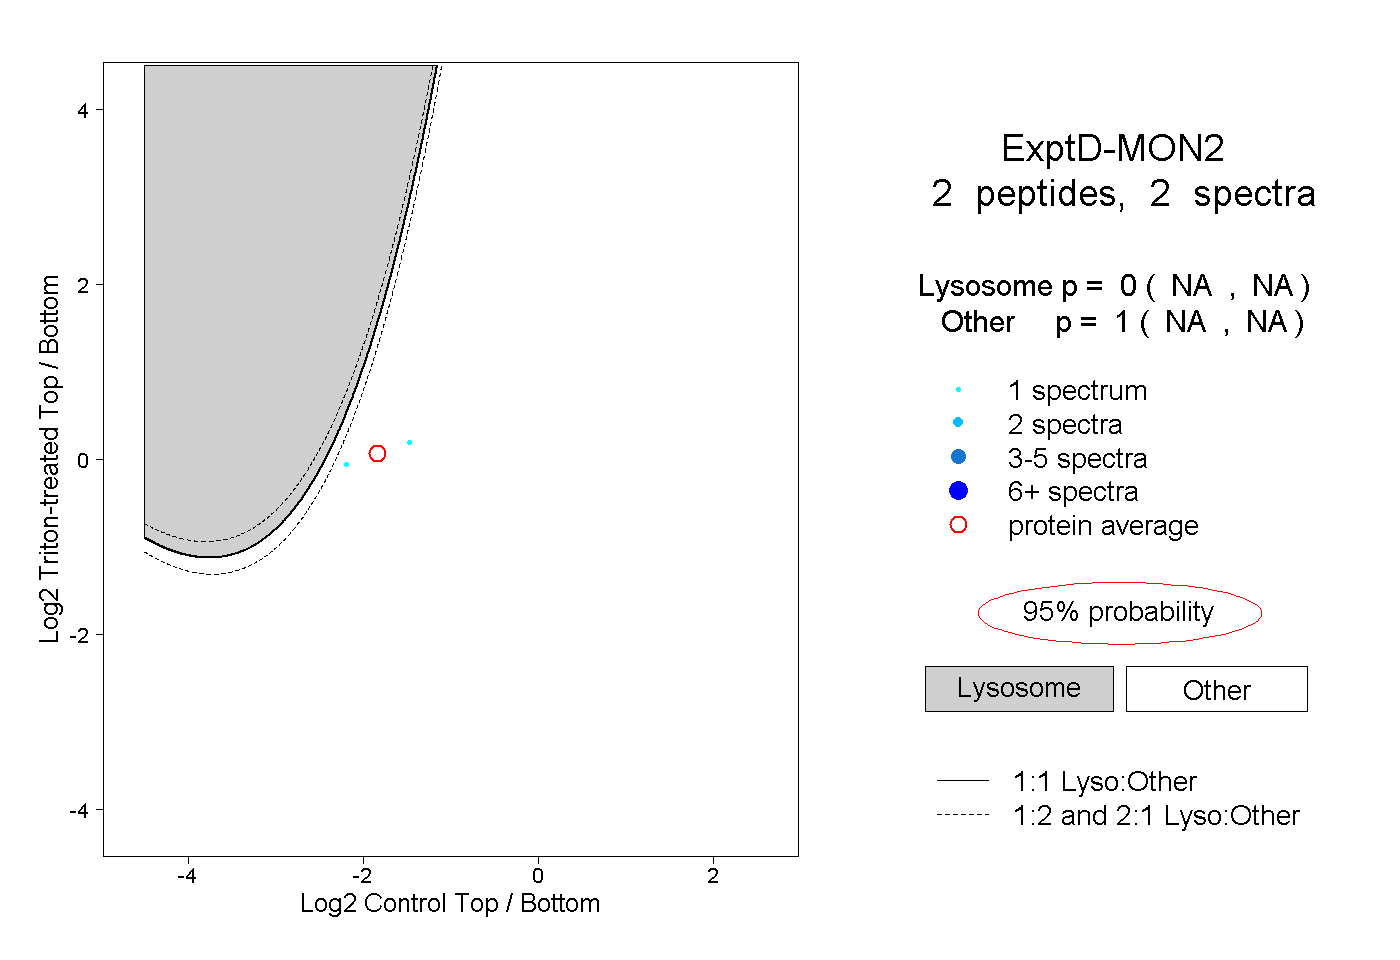 |
0.000 NA | NA |
1.000 NA | NA |