 7
7peptides
spectra
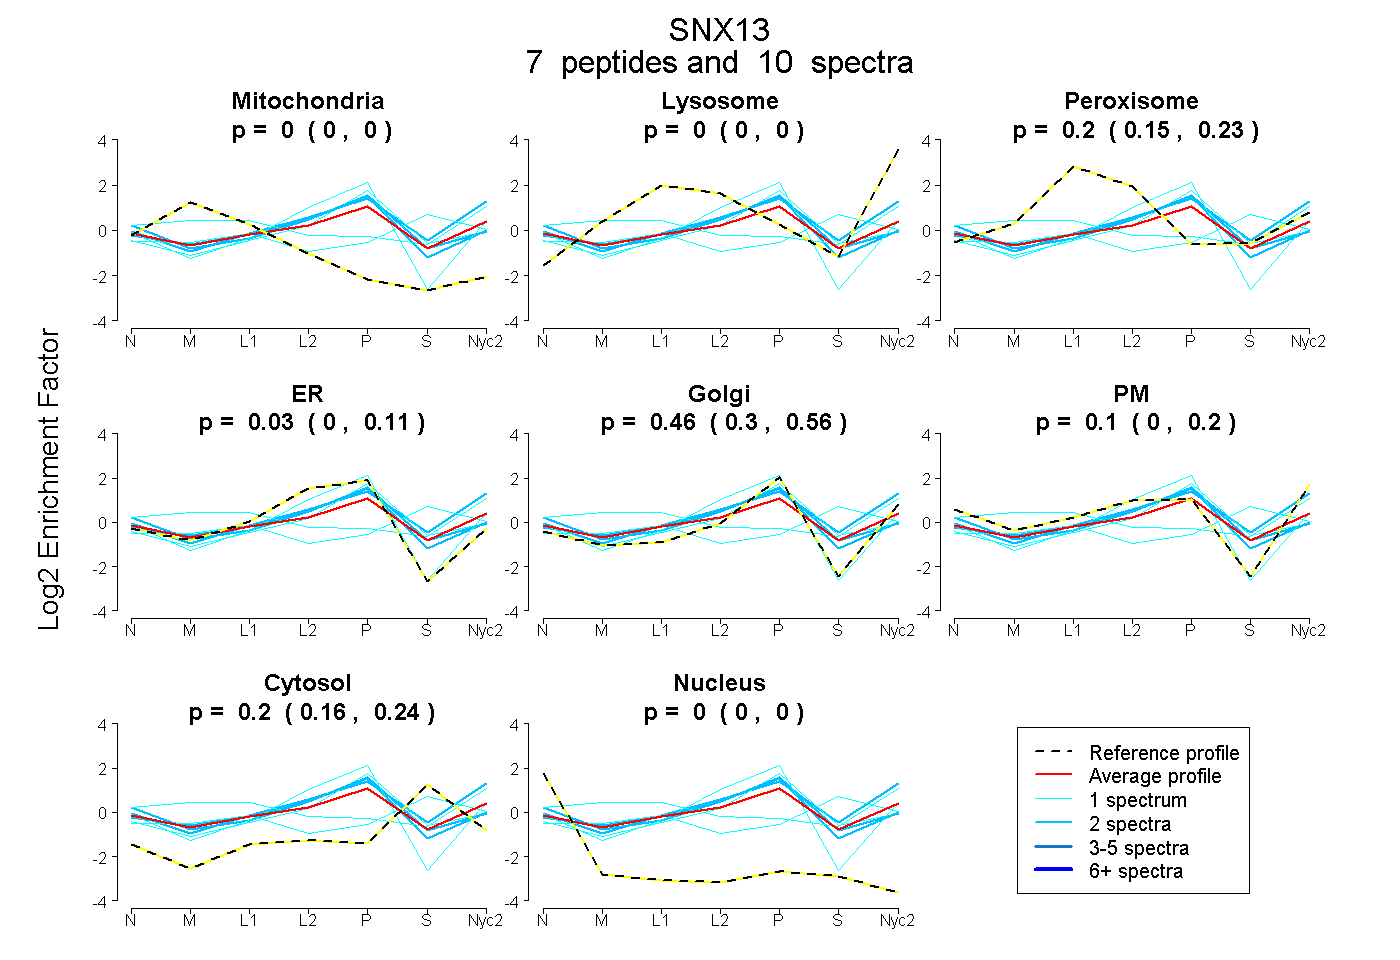
0.000 | 0.005
0.000 | 0.000
0.155 | 0.234
0.000 | 0.108
0.302 | 0.559
0.000 | 0.200
0.160 | 0.245
0.000 | 0.000
1peptide
spectrum
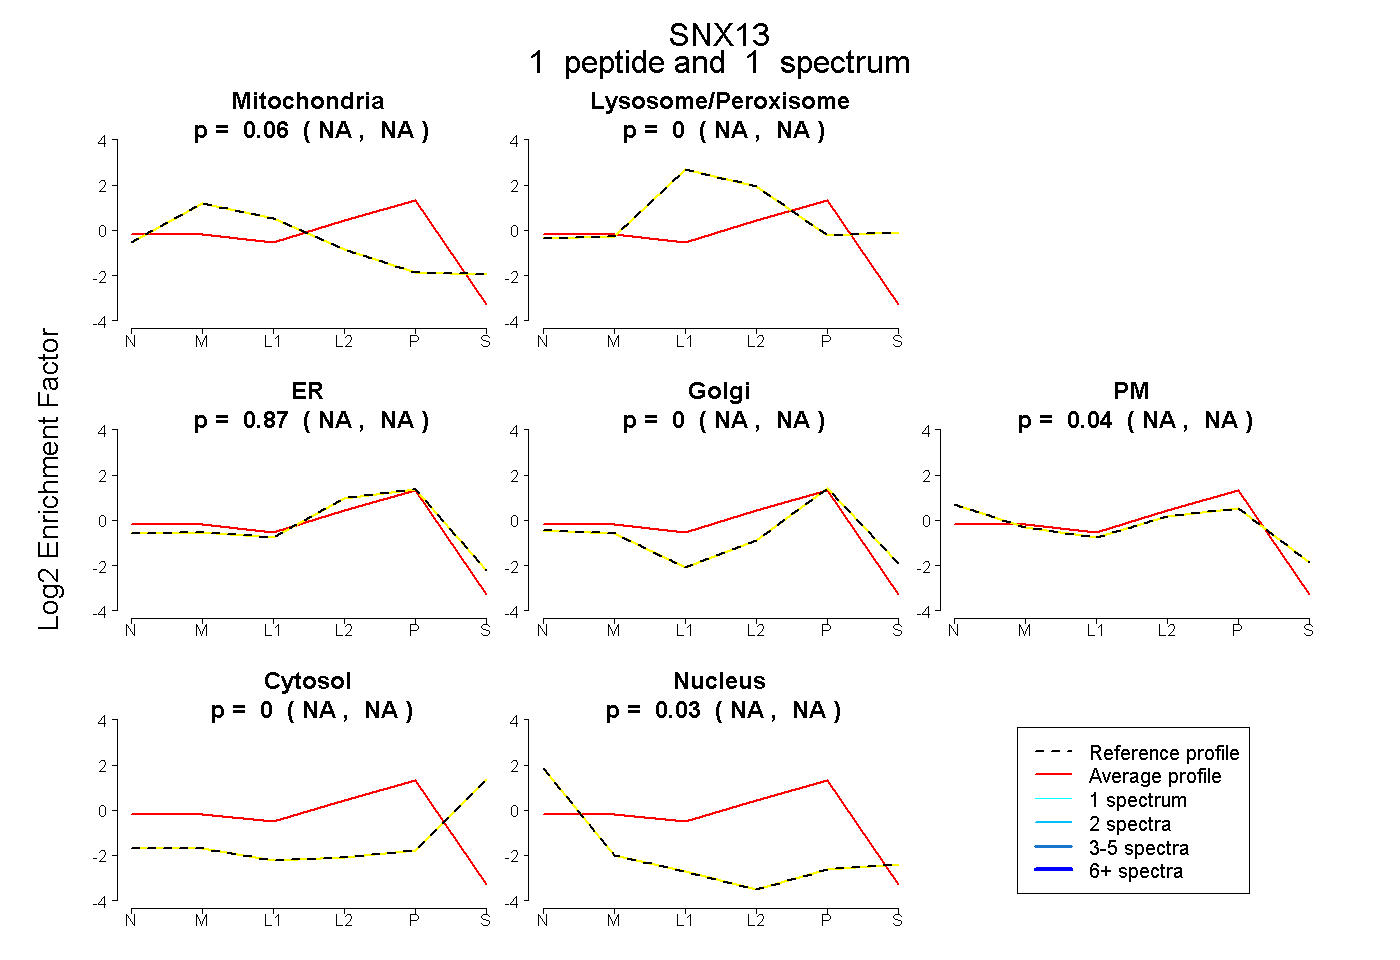
NA | NA
NA | NA
NA | NA
NA | NA
NA | NA
NA | NA
NA | NA
4peptides
spectra
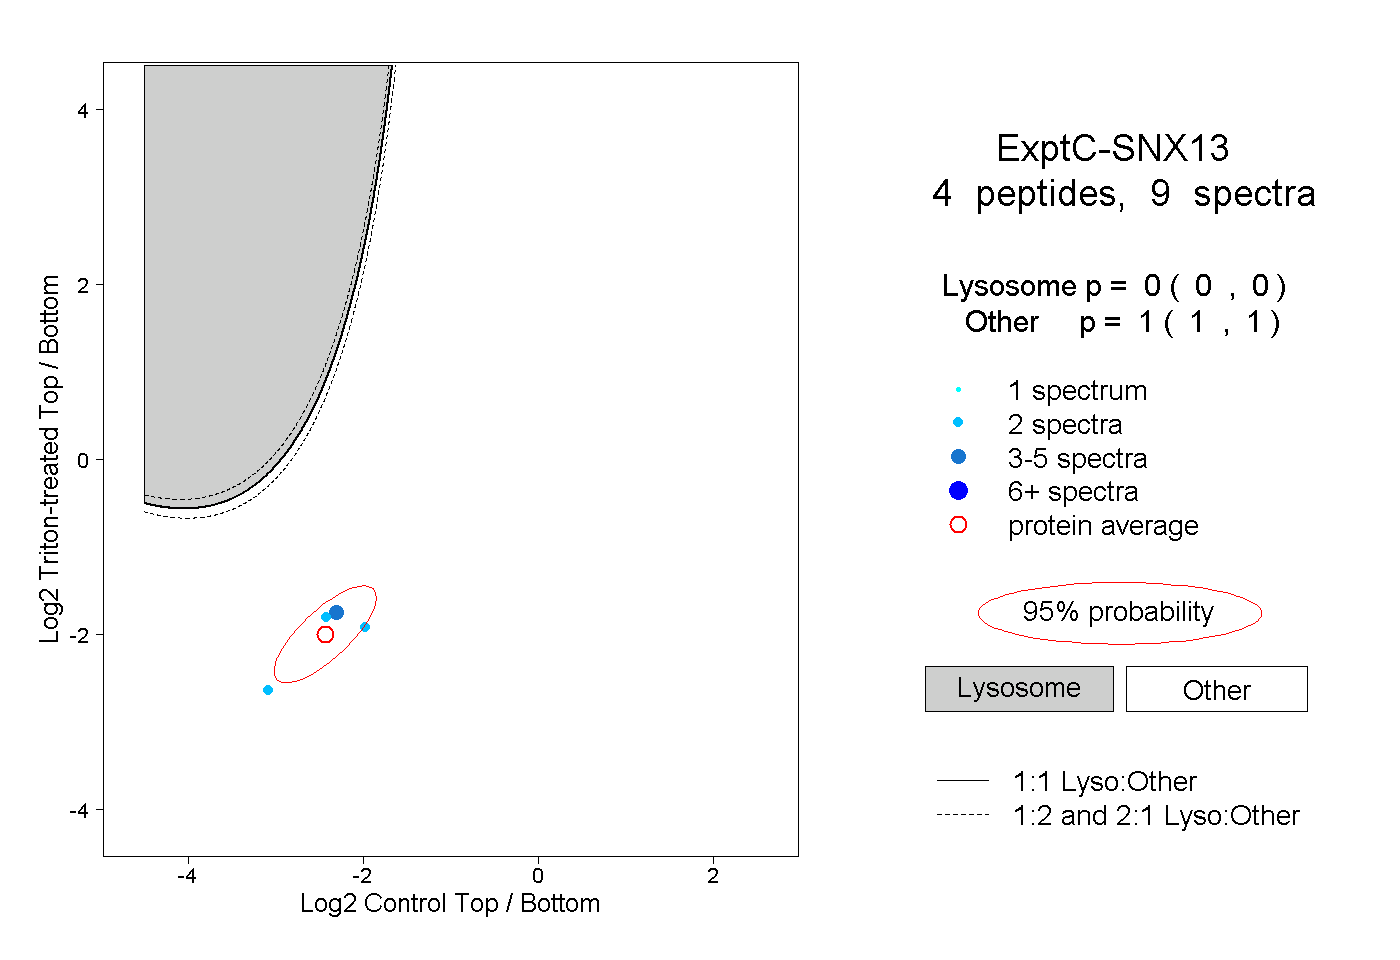
0.000 | 0.000
1.000 | 1.000