 7
7peptides
spectra
0.000 | 0.005
0.000 | 0.000
0.155 | 0.234
0.000 | 0.108
0.302 | 0.559
0.000 | 0.200
0.160 | 0.245
0.000 | 0.000
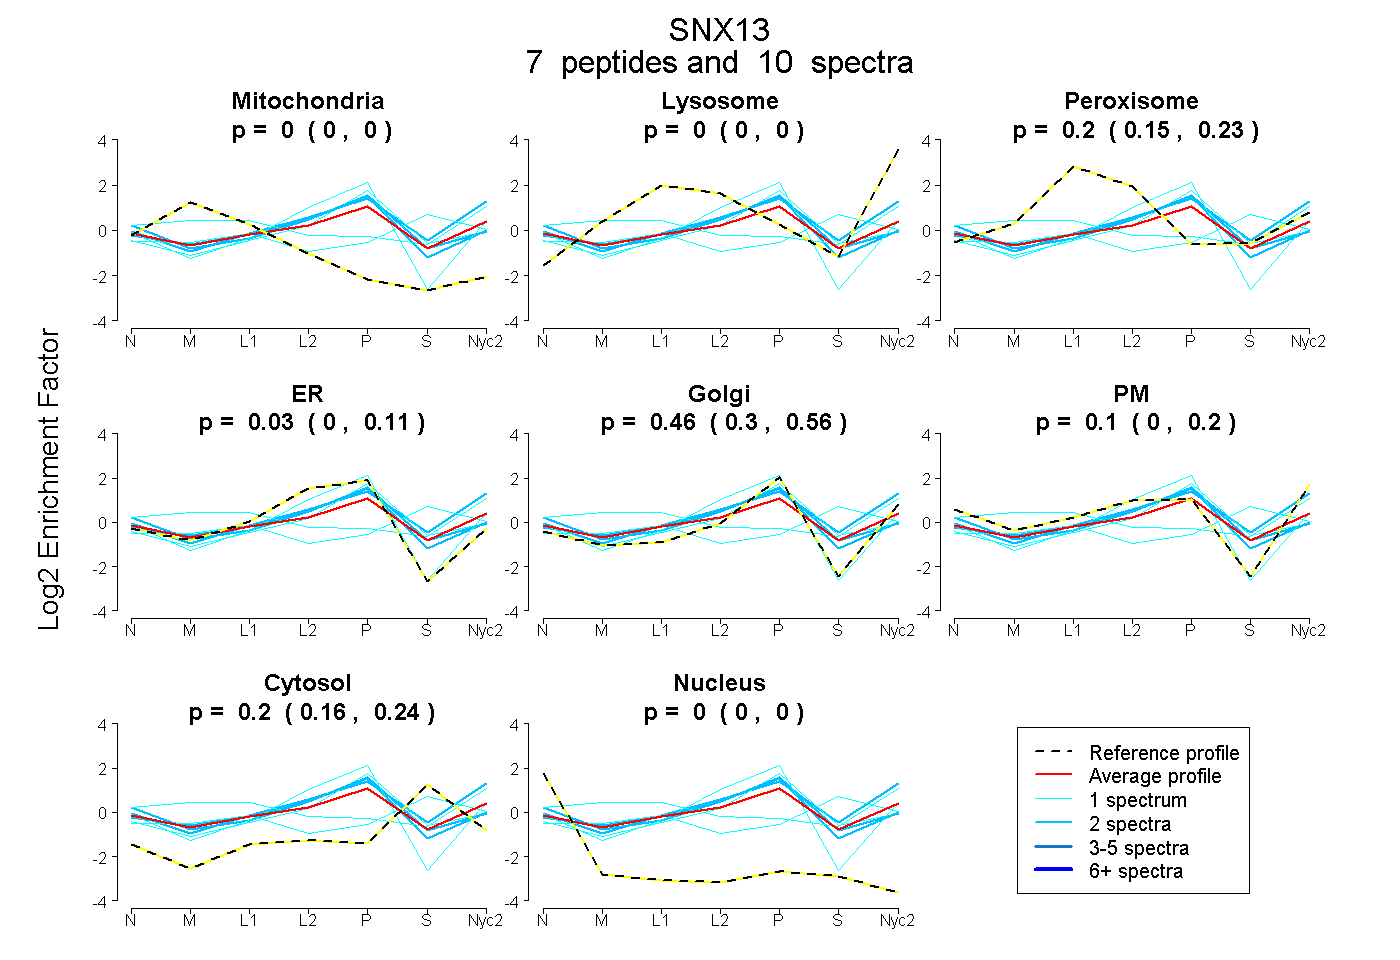
| Plot | Mito | Lyso | Perox | ER | Golgi | PM | Cytosol | Nucleus | |||||
| Expt A |
7 peptides |
10 spectra |
|
0.000 0.000 | 0.005 |
0.000 0.000 | 0.000 |
0.204 0.155 | 0.234 |
0.030 0.000 | 0.108 |
0.458 0.302 | 0.559 |
0.104 0.000 | 0.200 |
0.204 0.160 | 0.245 |
0.000 0.000 | 0.000 |
| 1 spectrum, QTLQNALIQFATR | 0.115 | 0.101 | 0.126 | 0.000 | 0.000 | 0.095 | 0.564 | 0.000 | ||
| 2 spectra, FYPSFR | 0.000 | 0.159 | 0.029 | 0.000 | 0.292 | 0.304 | 0.216 | 0.000 | ||
| 2 spectra, MVDDFGTHLR | 0.000 | 0.000 | 0.156 | 0.316 | 0.344 | 0.000 | 0.184 | 0.000 | ||
| 1 spectrum, LFAVMPDELK | 0.000 | 0.000 | 0.064 | 0.272 | 0.406 | 0.000 | 0.258 | 0.000 | ||
| 1 spectrum, NLLQQLIR | 0.000 | 0.000 | 0.000 | 0.521 | 0.410 | 0.069 | 0.000 | 0.000 | ||
| 1 spectrum, VSAQLDDNVDDNIPLR | 0.209 | 0.220 | 0.063 | 0.000 | 0.000 | 0.313 | 0.195 | 0.000 | ||
| 2 spectra, DEEGFLR | 0.000 | 0.000 | 0.000 | 0.426 | 0.150 | 0.215 | 0.208 | 0.000 |
| Plot | Mito | Lyso or Perox | ER | Golgi | PM | Cytosol | Nucleus | ||||||
| Expt B |
1 peptide |
1 spectrum |
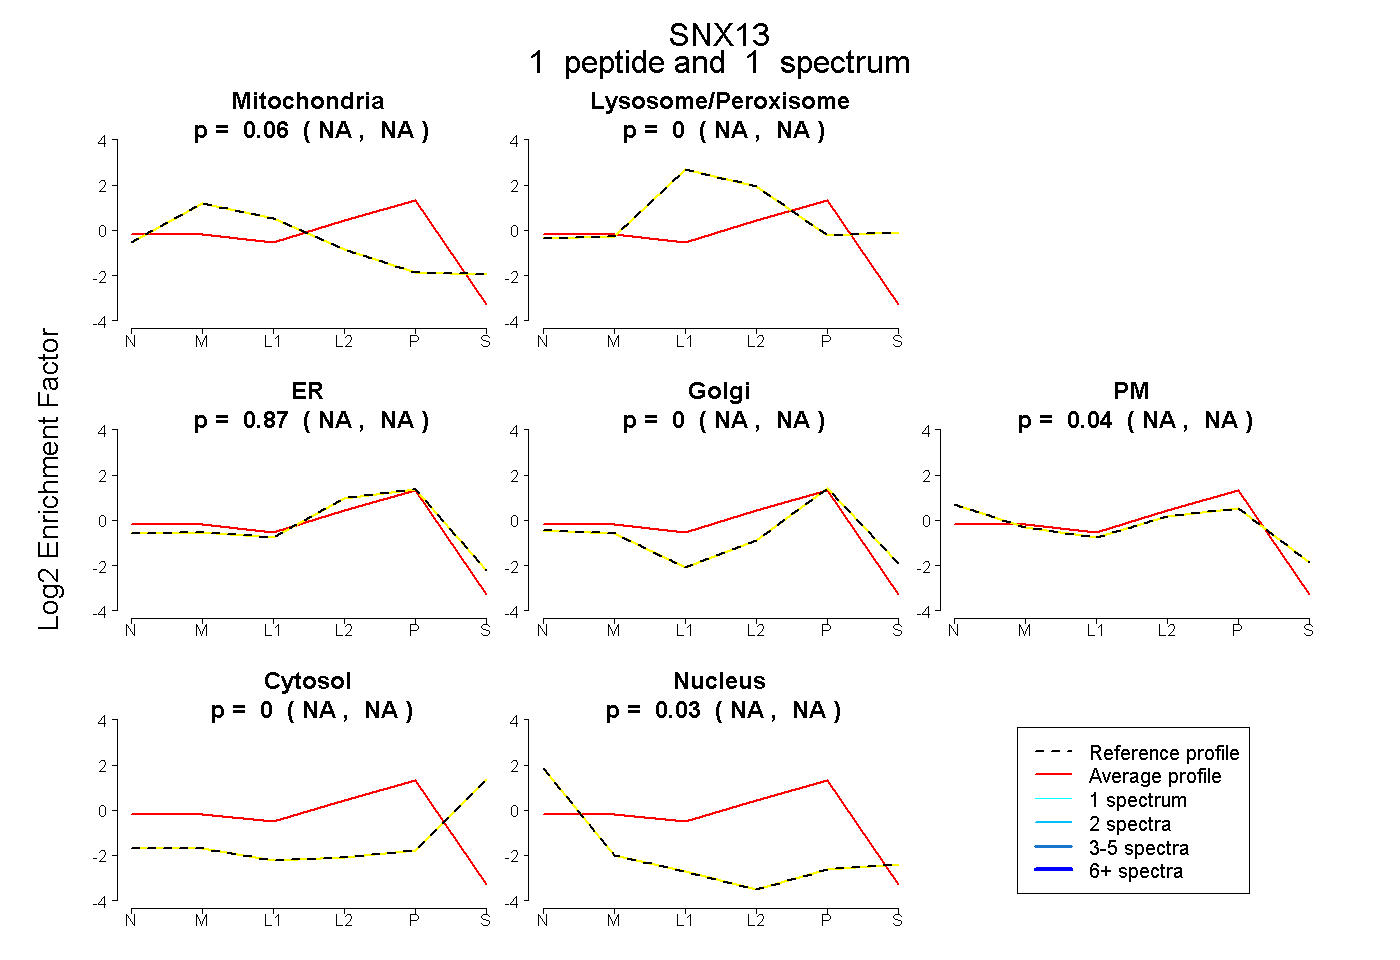 |
0.059 NA | NA |
0.000 NA | NA |
0.869 NA | NA |
0.000 NA | NA |
0.045 NA | NA |
0.000 NA | NA |
0.028 NA | NA |
|||
| Plot | Lyso | Other | |||||||||||
| Expt C |
4 peptides |
9 spectra |
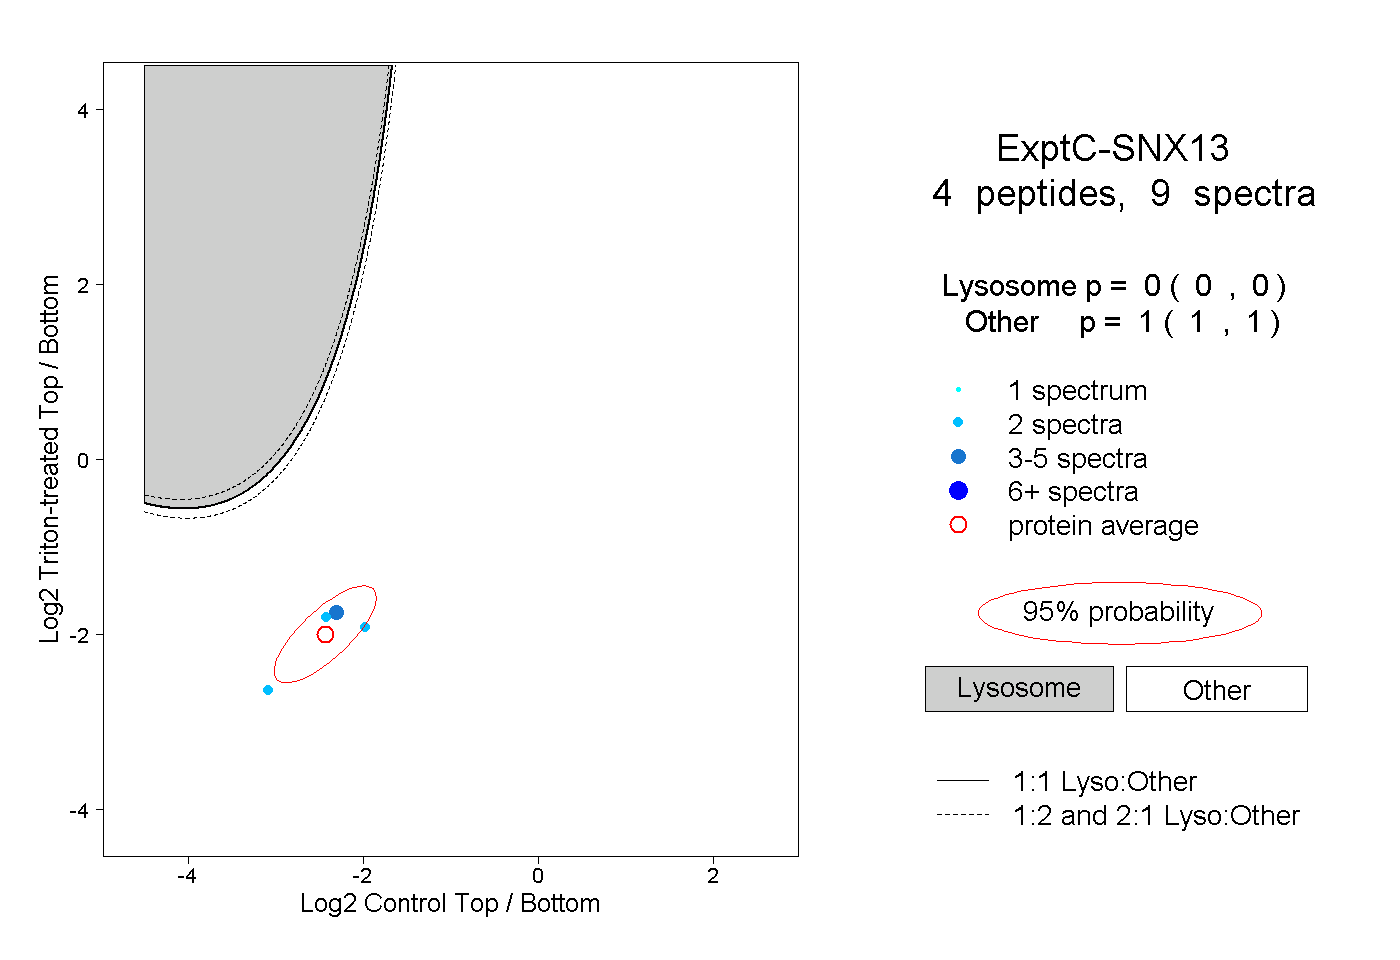 |
0.000 0.000 | 0.000 |
1.000 1.000 | 1.000 |