 6
6peptides
spectra
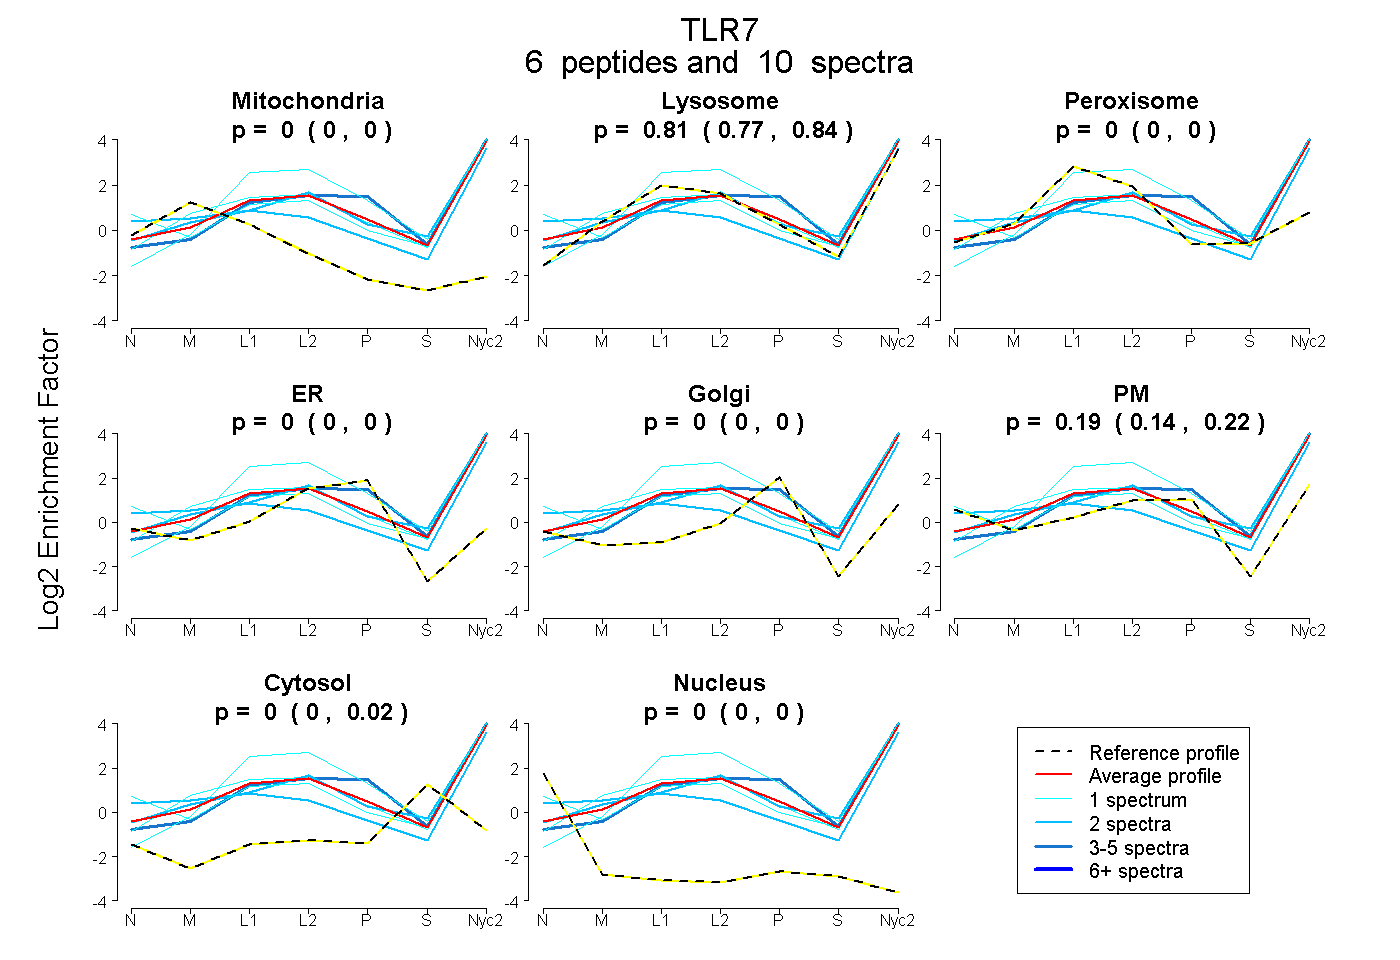
0.000 | 0.000
0.771 | 0.844
0.000 | 0.000
0.000 | 0.000
0.000 | 0.000
0.140 | 0.223
0.000 | 0.017
0.000 | 0.000
8peptides
spectra
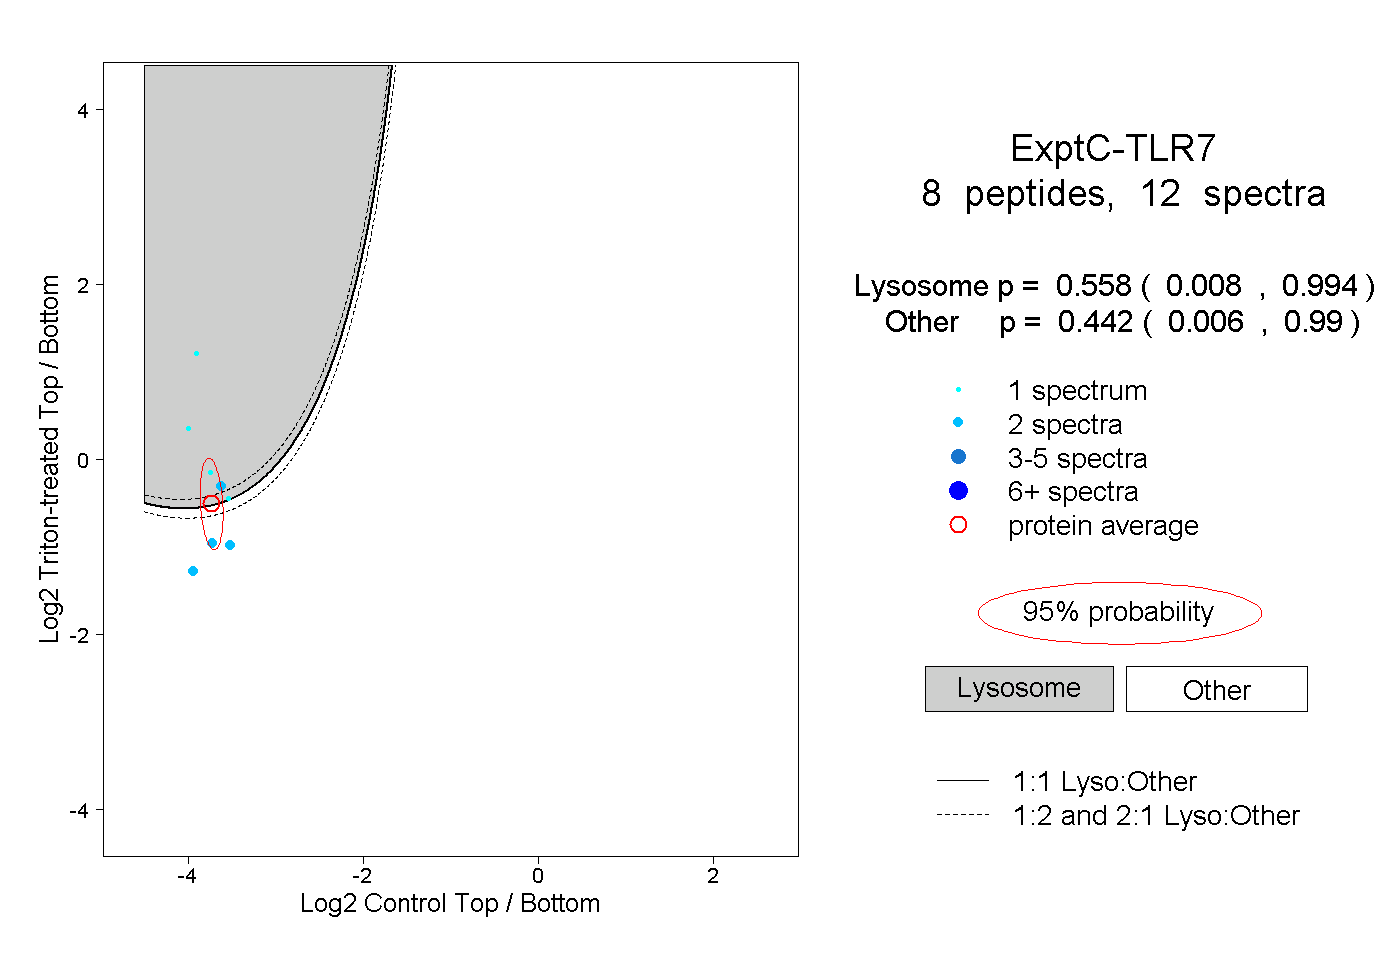
0.008 | 0.994
0.006 | 0.990
1peptide
spectrum
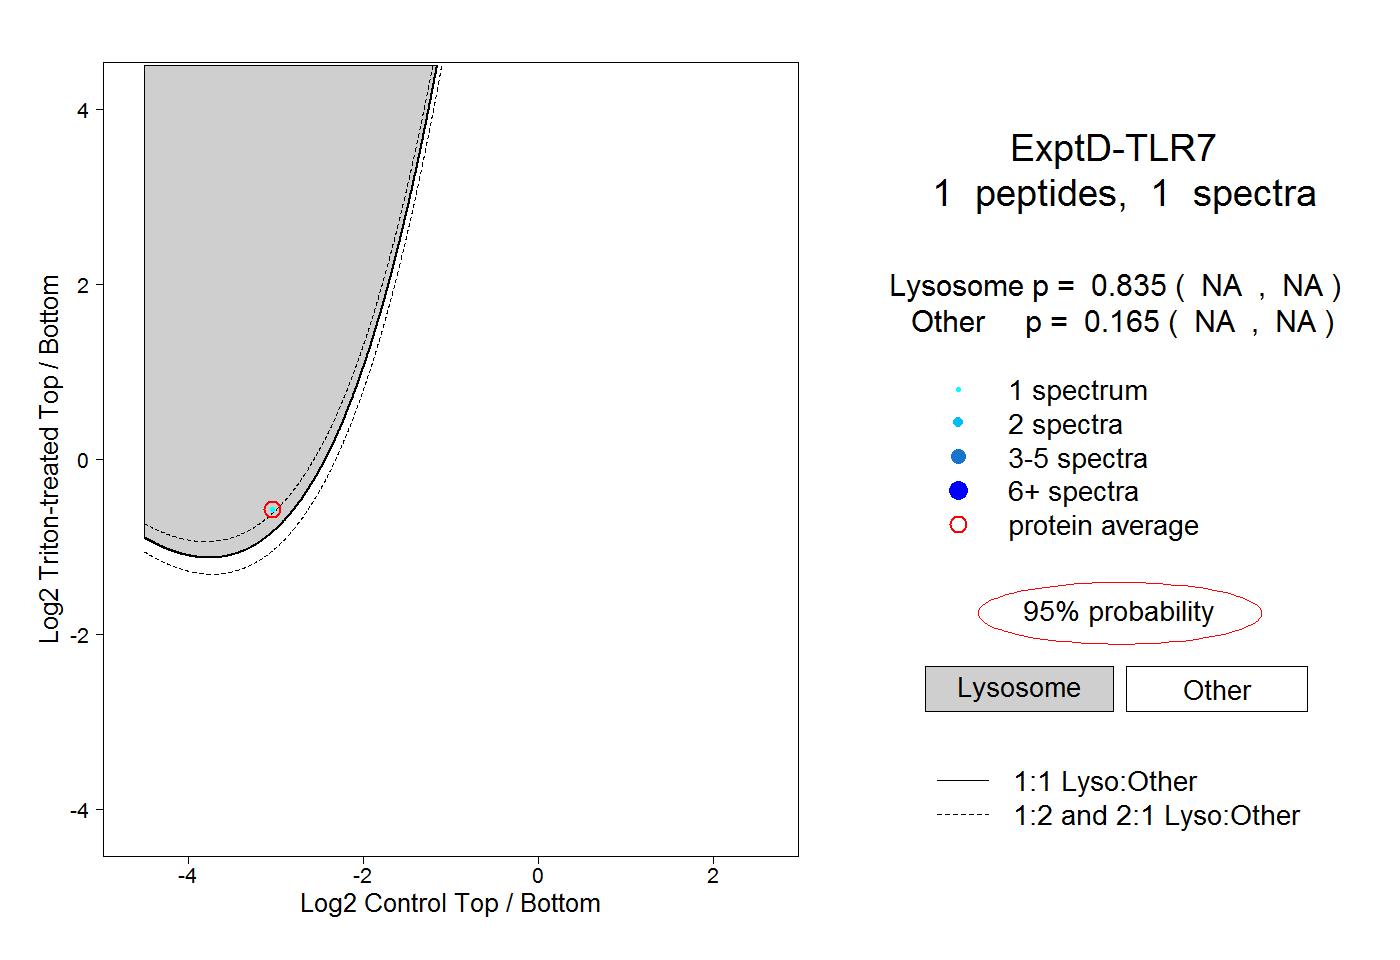
NA | NA
NA | NA