 6
6peptides
spectra
0.000 | 0.000
0.771 | 0.844
0.000 | 0.000
0.000 | 0.000
0.000 | 0.000
0.140 | 0.223
0.000 | 0.017
0.000 | 0.000
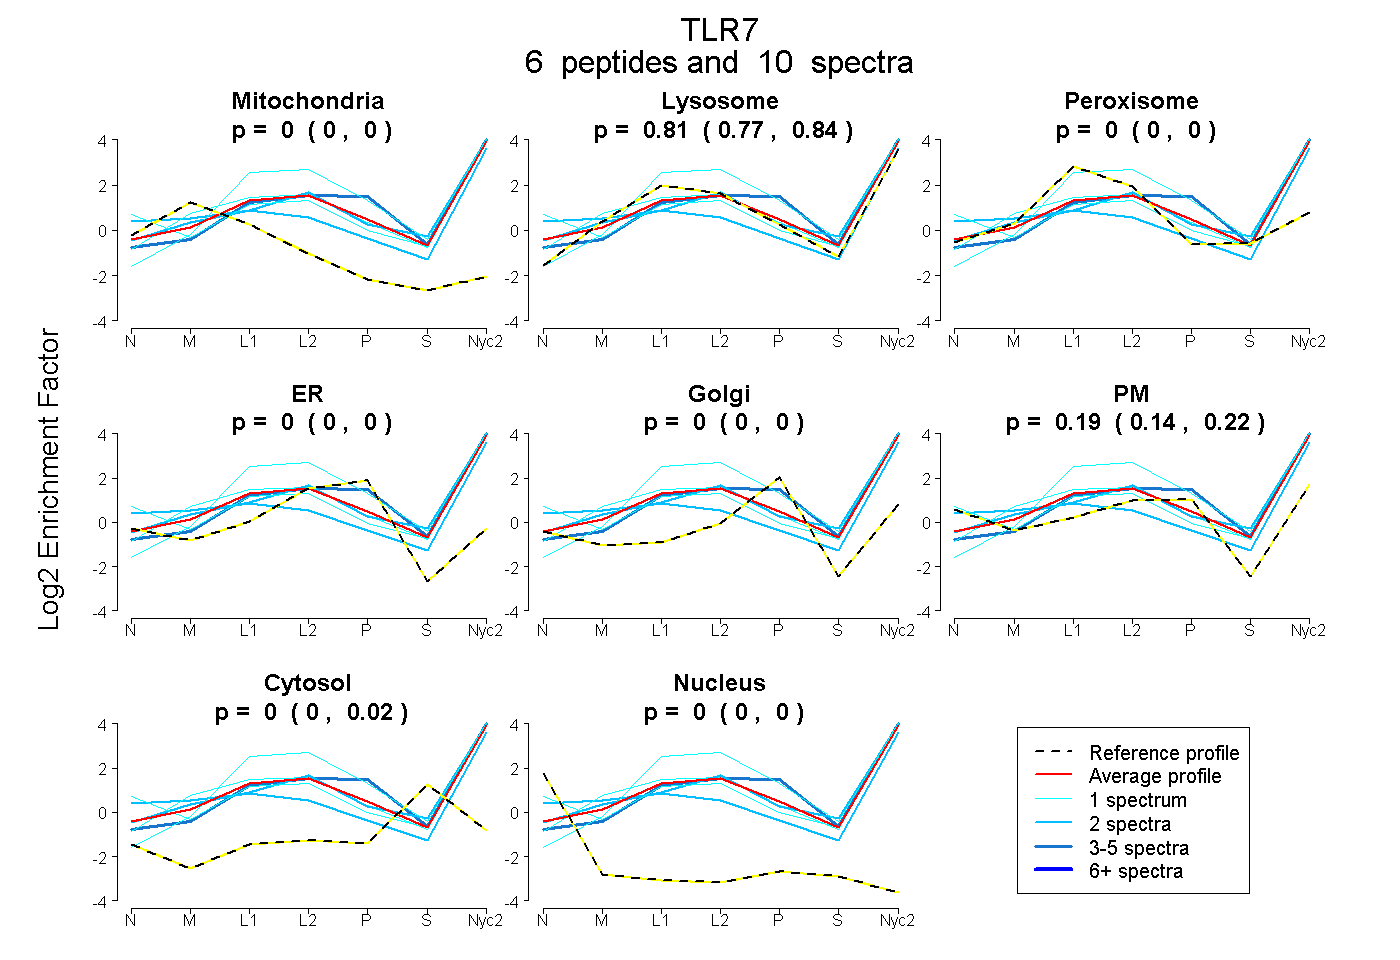
| Plot | Mito | Lyso | Perox | ER | Golgi | PM | Cytosol | Nucleus | |||||
| Expt A |
6 peptides |
10 spectra |
|
0.000 0.000 | 0.000 |
0.810 0.771 | 0.844 |
0.000 0.000 | 0.000 |
0.000 0.000 | 0.000 |
0.000 0.000 | 0.000 |
0.190 0.140 | 0.223 |
0.000 0.000 | 0.017 |
0.000 0.000 | 0.000 |
| 1 spectrum, YLDFFK | 0.000 | 1.000 | 0.000 | 0.000 | 0.000 | 0.000 | 0.000 | 0.000 | ||
| 2 spectra, TLDLSR | 0.000 | 0.842 | 0.000 | 0.000 | 0.000 | 0.115 | 0.043 | 0.000 | ||
| 3 spectra, LILNHNQIR | 0.000 | 0.825 | 0.000 | 0.000 | 0.175 | 0.000 | 0.000 | 0.000 | ||
| 1 spectrum, SFSWGR | 0.000 | 0.941 | 0.000 | 0.000 | 0.000 | 0.059 | 0.000 | 0.000 | ||
| 2 spectra, NLLNLEELDISR | 0.000 | 0.666 | 0.000 | 0.000 | 0.000 | 0.264 | 0.000 | 0.070 | ||
| 1 spectrum, YLDISSNK | 0.000 | 0.627 | 0.000 | 0.000 | 0.000 | 0.360 | 0.012 | 0.000 |
| Plot | Lyso | Other | |||||||||||
| Expt C |
8 peptides |
12 spectra |
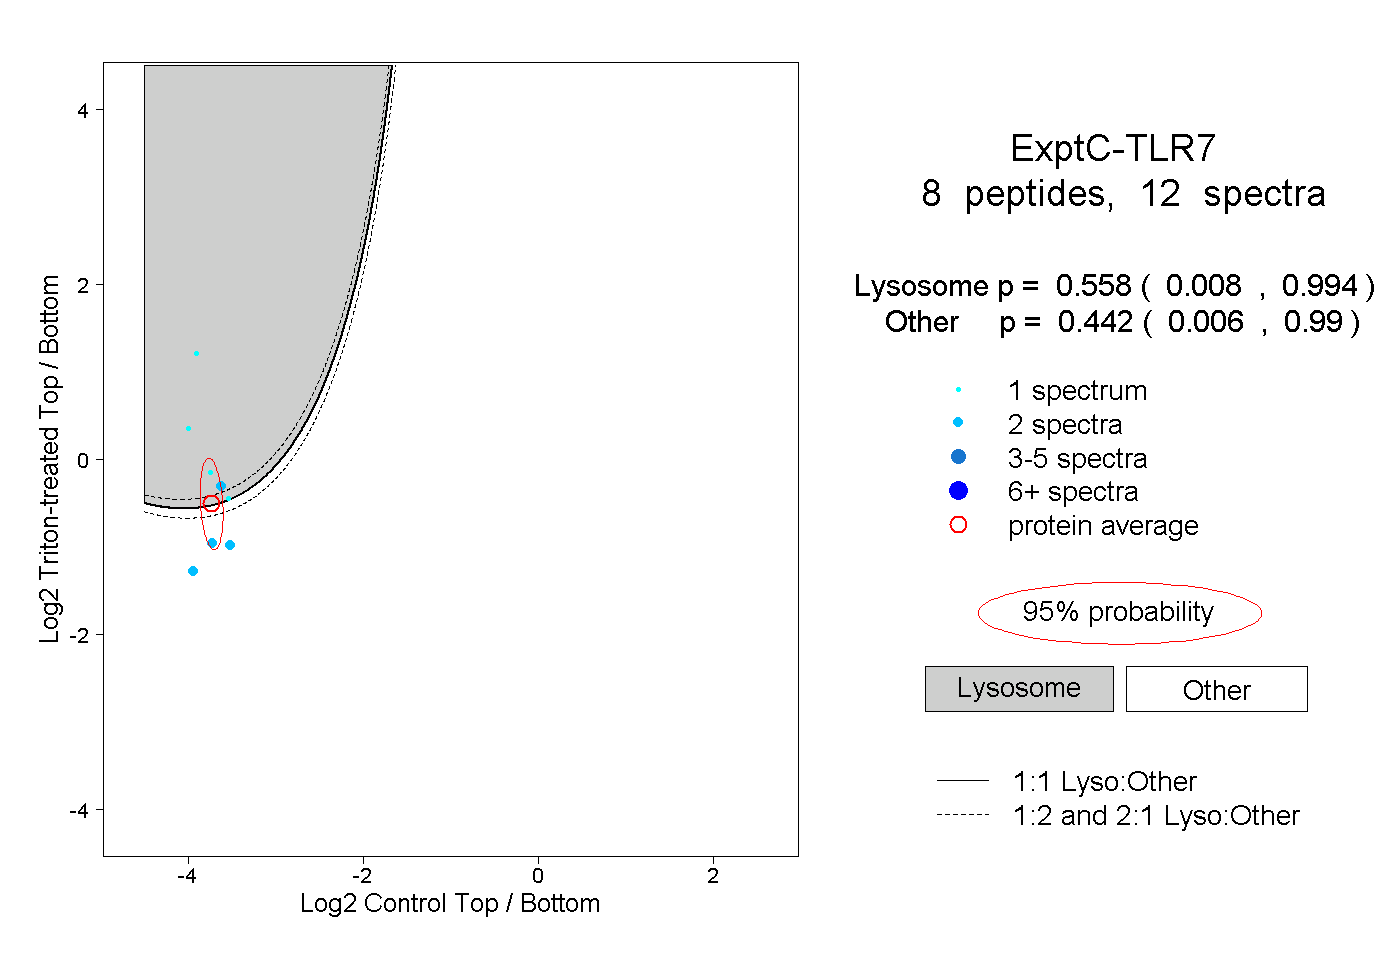 |
0.558 0.008 | 0.994 |
0.442 0.006 | 0.990 |
||||||||
| Plot | Lyso | Other | |||||||||||
| Expt D |
1 peptide |
1 spectrum |
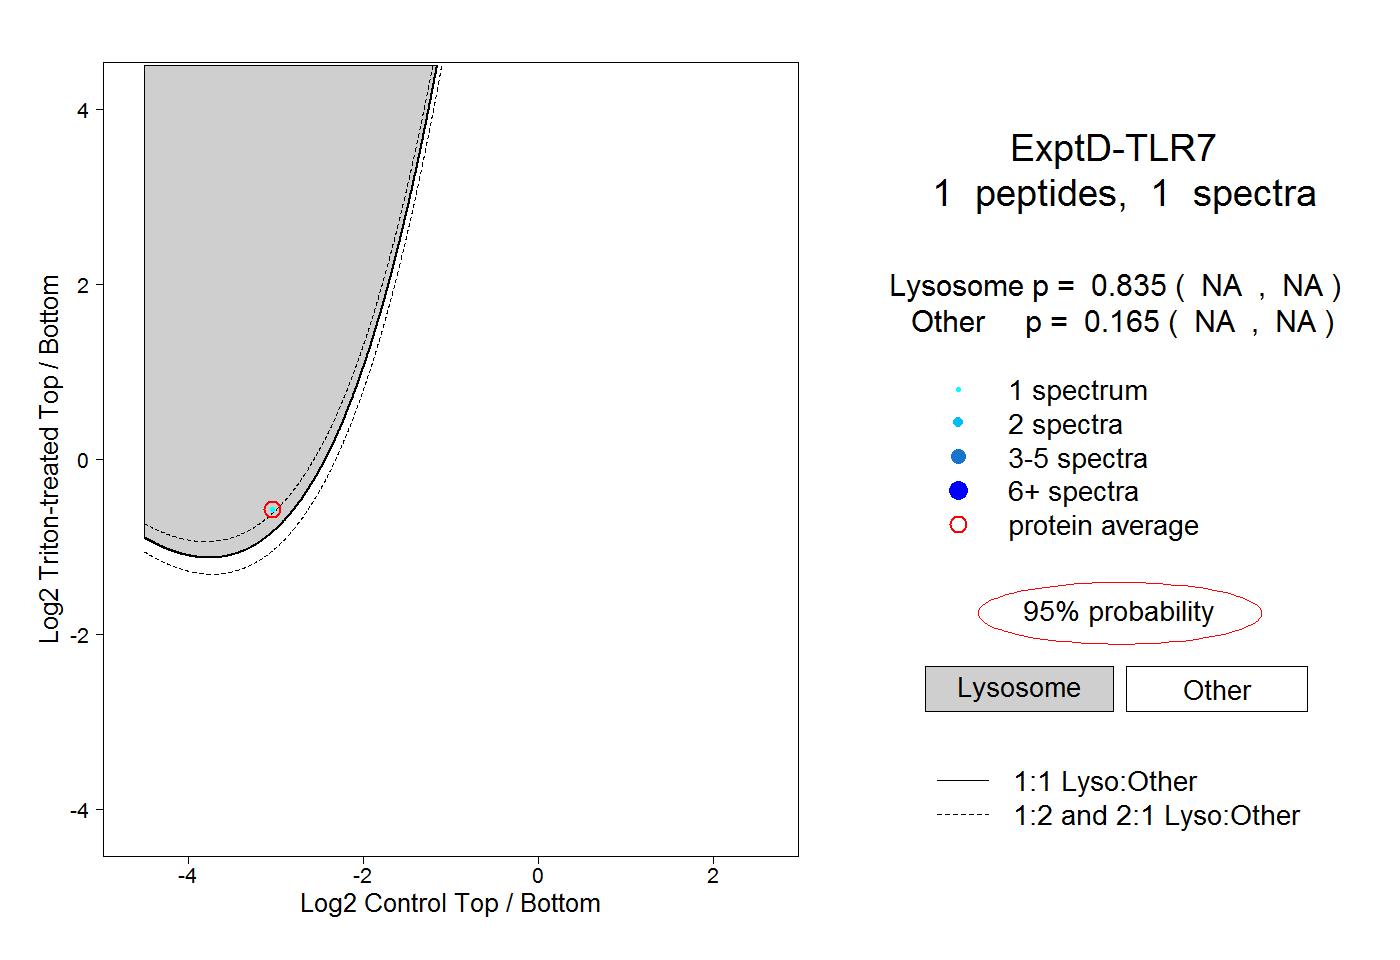 |
0.835 NA | NA |
0.165 NA | NA |