 3
3peptides
spectra
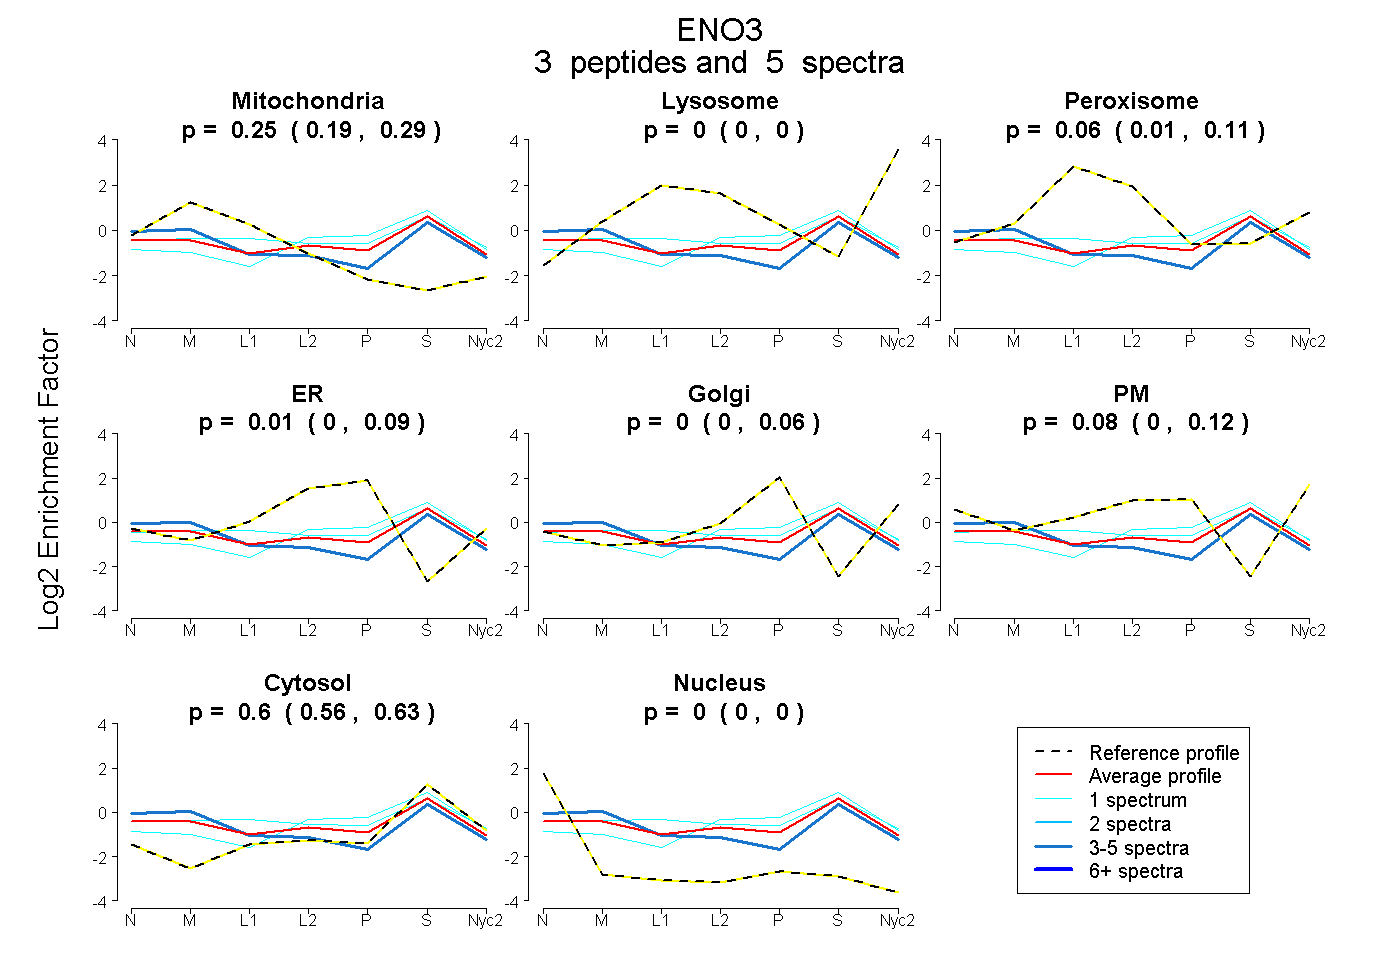
0.189 | 0.287
0.000 | 0.000
0.008 | 0.113
0.000 | 0.089
0.000 | 0.062
0.000 | 0.119
0.557 | 0.631
0.000 | 0.000
1peptide
spectra
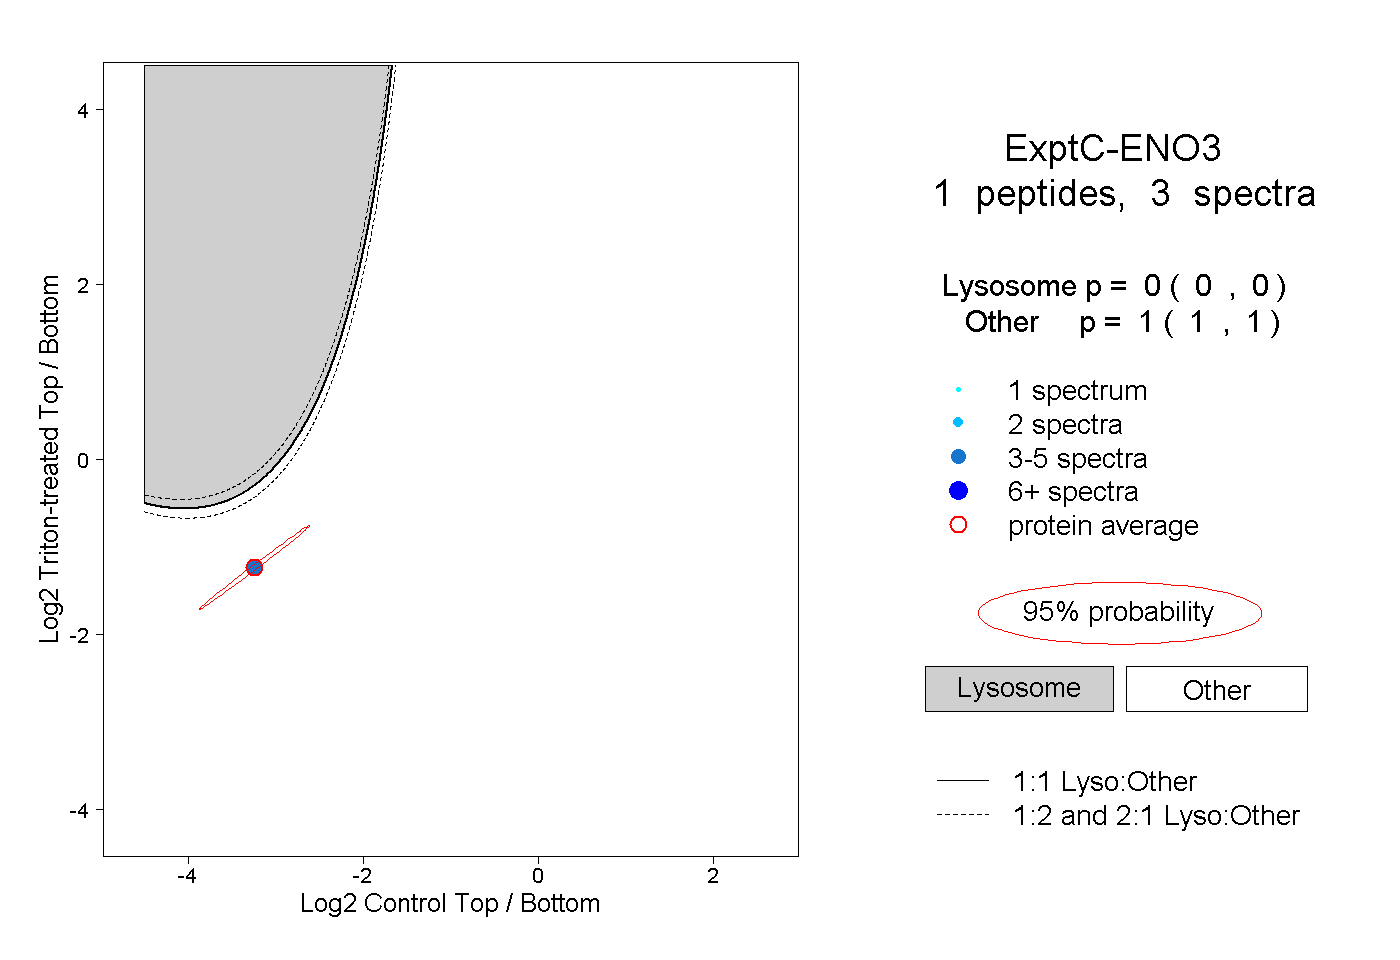
0.000 | 0.000
1.000 | 1.000
1peptide
spectrum
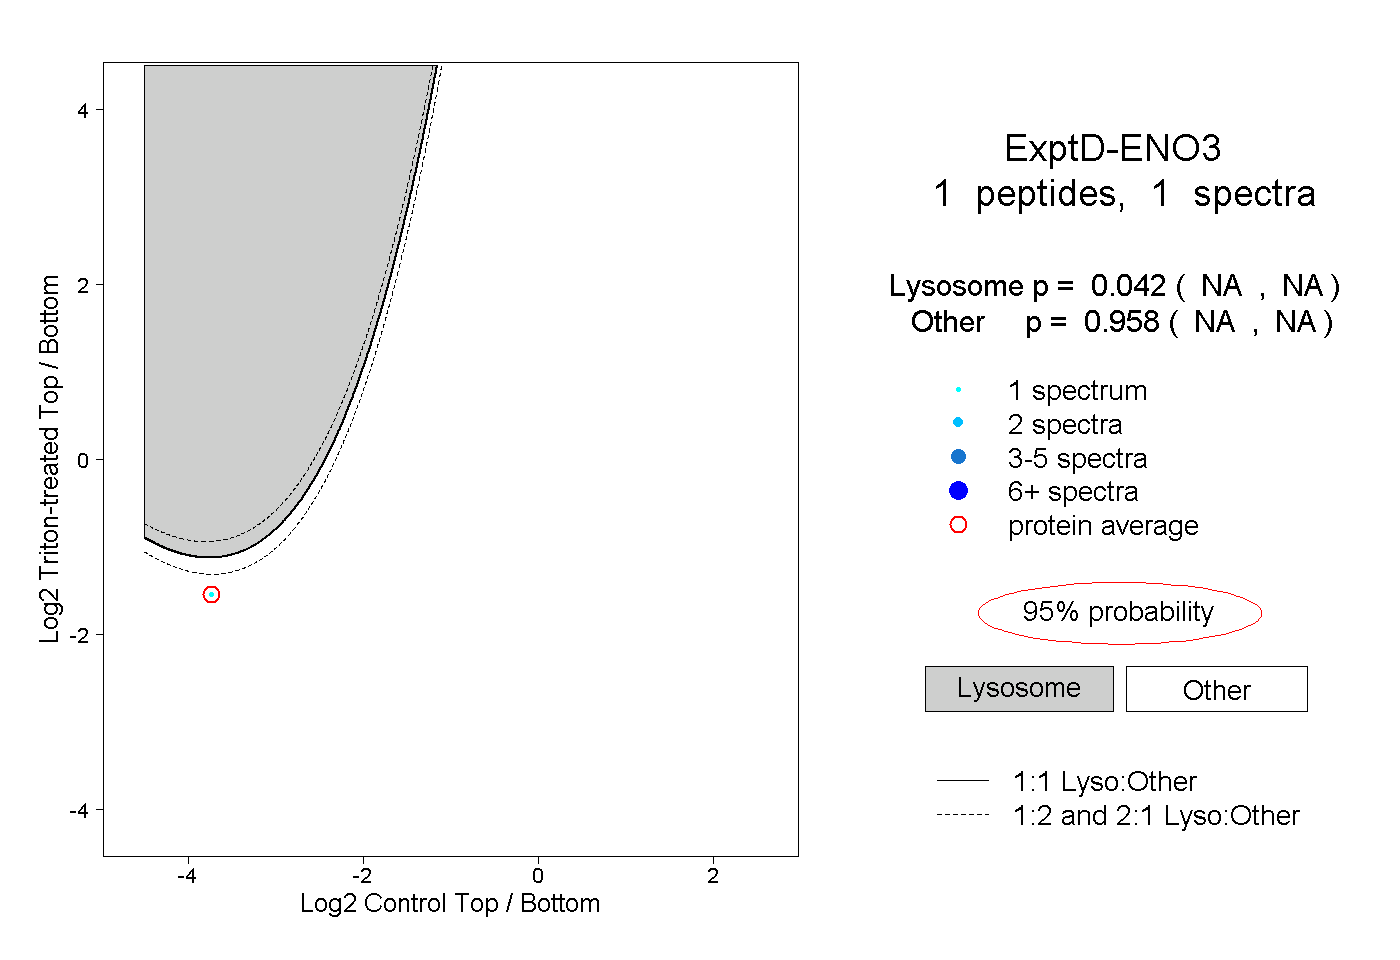
NA | NA
NA | NA